Zip Codes with the Highest Percentage of Households Heated by Fuel Oil / Kerosene in Colorado
RELATED REPORTS & OPTIONS
Fuel Oil Heating
Colorado
Compare Zip Codes
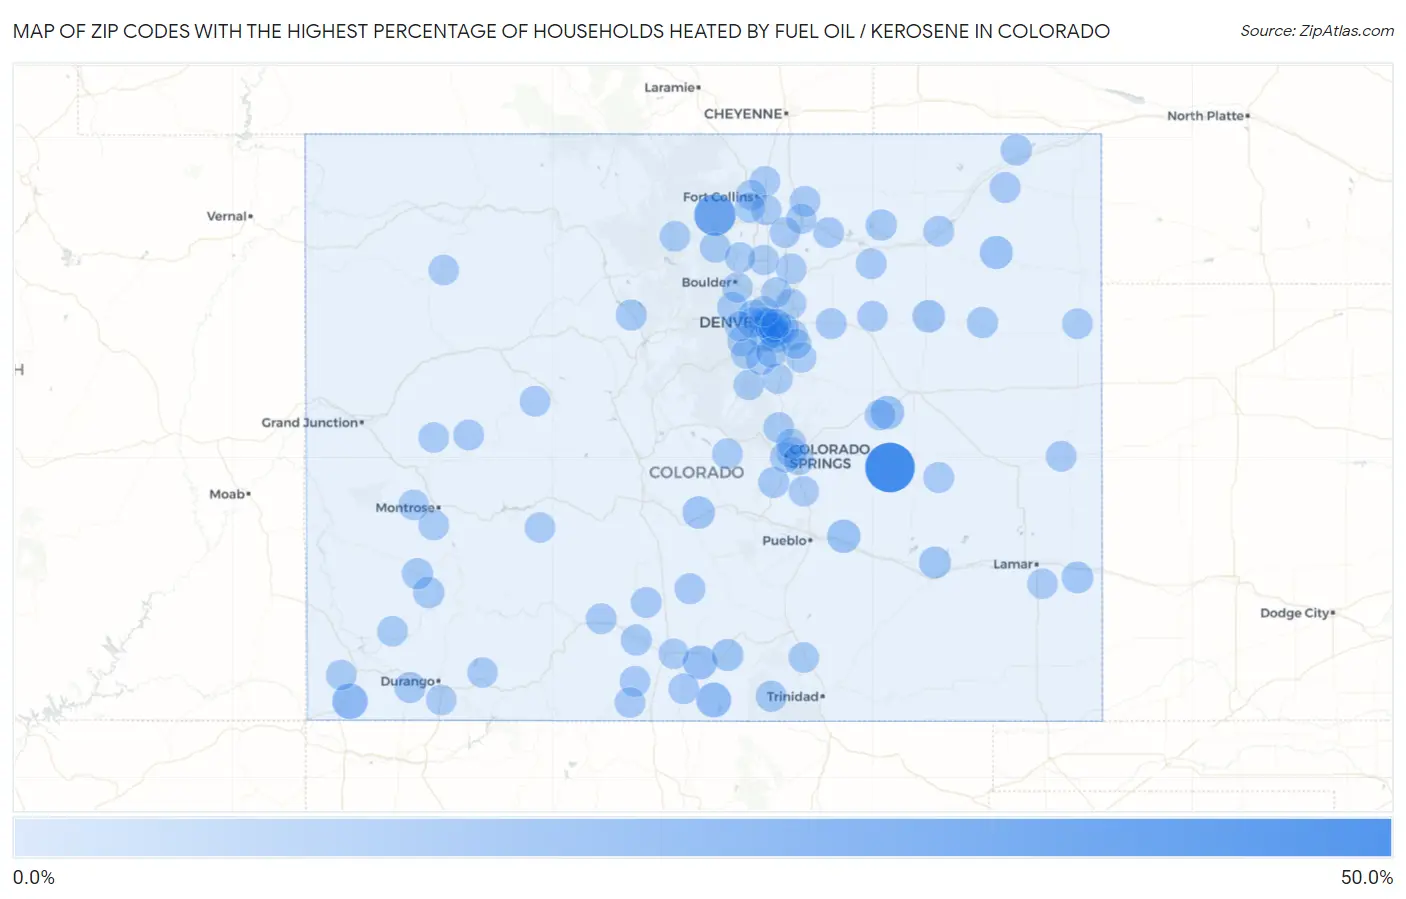
Map of Zip Codes with the Highest Percentage of Households Heated by Fuel Oil / Kerosene in Colorado
0.0%
50.0%
Zip Codes with the Highest Percentage of Households Heated by Fuel Oil / Kerosene in Colorado
| Zip Code | Fuel Oil Heating | vs State | vs National | |
| 1. | 80833 | 45.8% | 0.10%(+45.7)#1 | 4.2%(+41.6)#2,115 |
| 2. | 80532 | 26.3% | 0.10%(+26.2)#2 | 4.2%(+22.1)#3,652 |
| 3. | 81334 | 12.1% | 0.10%(+12.0)#3 | 4.2%(+7.90)#5,550 |
| 4. | 81152 | 10.6% | 0.10%(+10.5)#4 | 4.2%(+6.40)#5,930 |
| 5. | 81123 | 8.1% | 0.10%(+8.00)#5 | 4.2%(+3.90)#6,688 |
| 6. | 81025 | 6.9% | 0.10%(+6.80)#6 | 4.2%(+2.70)#7,170 |
| 7. | 80830 | 6.8% | 0.10%(+6.70)#7 | 4.2%(+2.60)#7,219 |
| 8. | 80743 | 6.4% | 0.10%(+6.30)#8 | 4.2%(+2.20)#7,401 |
| 9. | 80757 | 5.2% | 0.10%(+5.10)#9 | 4.2%(+1.00)#8,051 |
| 10. | 81223 | 4.9% | 0.10%(+4.80)#10 | 4.2%(+0.700)#8,192 |
| 11. | 81133 | 3.7% | 0.10%(+3.60)#11 | 4.2%(-0.500)#9,083 |
| 12. | 81030 | 3.6% | 0.10%(+3.50)#12 | 4.2%(-0.600)#9,180 |
| 13. | 81047 | 3.1% | 0.10%(+3.00)#13 | 4.2%(-1.10)#9,630 |
| 14. | 81435 | 2.2% | 0.10%(+2.10)#14 | 4.2%(-2.00)#10,640 |
| 15. | 80653 | 2.0% | 0.10%(+1.90)#15 | 4.2%(-2.20)#10,980 |
| 16. | 81430 | 2.0% | 0.10%(+1.90)#16 | 4.2%(-2.20)#10,988 |
| 17. | 80726 | 2.0% | 0.10%(+1.90)#17 | 4.2%(-2.20)#10,999 |
| 18. | 80801 | 2.0% | 0.10%(+1.90)#18 | 4.2%(-2.20)#11,004 |
| 19. | 81091 | 1.8% | 0.10%(+1.70)#19 | 4.2%(-2.40)#11,321 |
| 20. | 80498 | 1.6% | 0.10%(+1.50)#20 | 4.2%(-2.60)#11,551 |
| 21. | 81144 | 1.5% | 0.10%(+1.40)#21 | 4.2%(-2.70)#11,750 |
| 22. | 81326 | 1.5% | 0.10%(+1.40)#22 | 4.2%(-2.70)#11,786 |
| 23. | 80926 | 1.4% | 0.10%(+1.30)#23 | 4.2%(-2.80)#11,988 |
| 24. | 80728 | 1.4% | 0.10%(+1.30)#24 | 4.2%(-2.80)#12,006 |
| 25. | 80102 | 1.3% | 0.10%(+1.20)#25 | 4.2%(-2.90)#12,122 |
| 26. | 81125 | 1.2% | 0.10%(+1.10)#26 | 4.2%(-3.00)#12,364 |
| 27. | 81131 | 1.2% | 0.10%(+1.10)#27 | 4.2%(-3.00)#12,425 |
| 28. | 80654 | 1.1% | 0.10%(+1.00)#28 | 4.2%(-3.10)#12,596 |
| 29. | 80823 | 1.1% | 0.10%(+1.00)#29 | 4.2%(-3.10)#12,678 |
| 30. | 80403 | 1.0% | 0.10%(+0.900)#30 | 4.2%(-3.20)#12,730 |
| 31. | 81132 | 1.0% | 0.10%(+0.900)#31 | 4.2%(-3.20)#12,833 |
| 32. | 81654 | 1.0% | 0.10%(+0.900)#32 | 4.2%(-3.20)#12,877 |
| 33. | 80810 | 1.0% | 0.10%(+0.900)#33 | 4.2%(-3.20)#12,893 |
| 34. | 80733 | 1.0% | 0.10%(+0.900)#34 | 4.2%(-3.20)#12,913 |
| 35. | 80209 | 0.90% | 0.10%(+0.800)#35 | 4.2%(-3.30)#12,984 |
| 36. | 80644 | 0.90% | 0.10%(+0.800)#36 | 4.2%(-3.30)#13,129 |
| 37. | 81151 | 0.90% | 0.10%(+0.800)#37 | 4.2%(-3.30)#13,157 |
| 38. | 80103 | 0.80% | 0.10%(+0.700)#38 | 4.2%(-3.40)#13,435 |
| 39. | 80543 | 0.70% | 0.10%(+0.600)#39 | 4.2%(-3.50)#13,675 |
| 40. | 80615 | 0.70% | 0.10%(+0.600)#40 | 4.2%(-3.50)#13,679 |
| 41. | 80816 | 0.70% | 0.10%(+0.600)#41 | 4.2%(-3.50)#13,703 |
| 42. | 81425 | 0.70% | 0.10%(+0.600)#42 | 4.2%(-3.50)#13,716 |
| 43. | 81323 | 0.70% | 0.10%(+0.600)#43 | 4.2%(-3.50)#13,725 |
| 44. | 81428 | 0.70% | 0.10%(+0.600)#44 | 4.2%(-3.50)#13,753 |
| 45. | 81140 | 0.70% | 0.10%(+0.600)#45 | 4.2%(-3.50)#13,806 |
| 46. | 80735 | 0.70% | 0.10%(+0.600)#46 | 4.2%(-3.50)#13,868 |
| 47. | 81321 | 0.60% | 0.10%(+0.500)#47 | 4.2%(-3.60)#14,028 |
| 48. | 81403 | 0.60% | 0.10%(+0.500)#48 | 4.2%(-3.60)#14,050 |
| 49. | 81120 | 0.60% | 0.10%(+0.500)#49 | 4.2%(-3.60)#14,195 |
| 50. | 80832 | 0.60% | 0.10%(+0.500)#50 | 4.2%(-3.60)#14,230 |
| 51. | 80013 | 0.50% | 0.10%(+0.400)#51 | 4.2%(-3.70)#14,267 |
| 52. | 80524 | 0.50% | 0.10%(+0.400)#52 | 4.2%(-3.70)#14,319 |
| 53. | 80237 | 0.50% | 0.10%(+0.400)#53 | 4.2%(-3.70)#14,405 |
| 54. | 81230 | 0.50% | 0.10%(+0.400)#54 | 4.2%(-3.70)#14,495 |
| 55. | 81413 | 0.50% | 0.10%(+0.400)#55 | 4.2%(-3.70)#14,557 |
| 56. | 80447 | 0.50% | 0.10%(+0.400)#56 | 4.2%(-3.70)#14,633 |
| 57. | 80247 | 0.40% | 0.10%(+0.300)#57 | 4.2%(-3.80)#14,825 |
| 58. | 80921 | 0.40% | 0.10%(+0.300)#58 | 4.2%(-3.80)#14,858 |
| 59. | 80203 | 0.40% | 0.10%(+0.300)#59 | 4.2%(-3.80)#14,871 |
| 60. | 80002 | 0.40% | 0.10%(+0.300)#60 | 4.2%(-3.80)#14,879 |
| 61. | 81303 | 0.40% | 0.10%(+0.300)#61 | 4.2%(-3.80)#15,004 |
| 62. | 81020 | 0.40% | 0.10%(+0.300)#62 | 4.2%(-3.80)#15,171 |
| 63. | 80218 | 0.30% | 0.10%(+0.200)#63 | 4.2%(-3.90)#15,496 |
| 64. | 80905 | 0.30% | 0.10%(+0.200)#64 | 4.2%(-3.90)#15,516 |
| 65. | 80621 | 0.30% | 0.10%(+0.200)#65 | 4.2%(-3.90)#15,566 |
| 66. | 81122 | 0.30% | 0.10%(+0.200)#66 | 4.2%(-3.90)#15,636 |
| 67. | 80135 | 0.30% | 0.10%(+0.200)#67 | 4.2%(-3.90)#15,735 |
| 68. | 81641 | 0.30% | 0.10%(+0.200)#68 | 4.2%(-3.90)#15,743 |
| 69. | 80012 | 0.20% | 0.10%(+0.100)#69 | 4.2%(-4.00)#15,903 |
| 70. | 80521 | 0.20% | 0.10%(+0.100)#70 | 4.2%(-4.00)#16,021 |
| 71. | 80909 | 0.20% | 0.10%(+0.100)#71 | 4.2%(-4.00)#16,033 |
| 72. | 80138 | 0.20% | 0.10%(+0.100)#72 | 4.2%(-4.00)#16,040 |
| 73. | 80204 | 0.20% | 0.10%(+0.100)#73 | 4.2%(-4.00)#16,051 |
| 74. | 80817 | 0.20% | 0.10%(+0.100)#74 | 4.2%(-4.00)#16,104 |
| 75. | 80109 | 0.20% | 0.10%(+0.100)#75 | 4.2%(-4.00)#16,155 |
| 76. | 80110 | 0.20% | 0.10%(+0.100)#76 | 4.2%(-4.00)#16,216 |
| 77. | 80528 | 0.20% | 0.10%(+0.100)#77 | 4.2%(-4.00)#16,218 |
| 78. | 80222 | 0.20% | 0.10%(+0.100)#78 | 4.2%(-4.00)#16,226 |
| 79. | 80215 | 0.20% | 0.10%(+0.100)#79 | 4.2%(-4.00)#16,295 |
| 80. | 80305 | 0.20% | 0.10%(+0.100)#80 | 4.2%(-4.00)#16,350 |
| 81. | 80465 | 0.20% | 0.10%(+0.100)#81 | 4.2%(-4.00)#16,363 |
| 82. | 81101 | 0.20% | 0.10%(+0.100)#82 | 4.2%(-4.00)#16,368 |
| 83. | 80246 | 0.20% | 0.10%(+0.100)#83 | 4.2%(-4.00)#16,420 |
| 84. | 80125 | 0.20% | 0.10%(+0.100)#84 | 4.2%(-4.00)#16,421 |
| 85. | 81052 | 0.20% | 0.10%(+0.100)#85 | 4.2%(-4.00)#16,480 |
| 86. | 80540 | 0.20% | 0.10%(+0.100)#86 | 4.2%(-4.00)#16,552 |
| 87. | 80016 | 0.10% | 0.10%(=0.000)#87 | 4.2%(-4.10)#16,691 |
| 88. | 80504 | 0.10% | 0.10%(=0.000)#88 | 4.2%(-4.10)#16,717 |
| 89. | 80022 | 0.10% | 0.10%(=0.000)#89 | 4.2%(-4.10)#16,730 |
| 90. | 80631 | 0.10% | 0.10%(=0.000)#90 | 4.2%(-4.10)#16,762 |
| 91. | 80918 | 0.10% | 0.10%(=0.000)#91 | 4.2%(-4.10)#16,818 |
| 92. | 80526 | 0.10% | 0.10%(=0.000)#92 | 4.2%(-4.10)#16,901 |
| 93. | 80127 | 0.10% | 0.10%(=0.000)#93 | 4.2%(-4.10)#16,904 |
| 94. | 80126 | 0.10% | 0.10%(=0.000)#94 | 4.2%(-4.10)#16,913 |
| 95. | 80401 | 0.10% | 0.10%(=0.000)#95 | 4.2%(-4.10)#16,918 |
| 96. | 80602 | 0.10% | 0.10%(=0.000)#96 | 4.2%(-4.10)#16,952 |
| 97. | 80221 | 0.10% | 0.10%(=0.000)#97 | 4.2%(-4.10)#16,963 |
| 98. | 80916 | 0.10% | 0.10%(=0.000)#98 | 4.2%(-4.10)#16,975 |
| 99. | 80220 | 0.10% | 0.10%(=0.000)#99 | 4.2%(-4.10)#17,050 |
| 100. | 80503 | 0.10% | 0.10%(=0.000)#100 | 4.2%(-4.10)#17,051 |
Common Questions
What are the Top 10 Zip Codes with the Highest Percentage of Households Heated by Fuel Oil / Kerosene in Colorado?
Top 10 Zip Codes with the Highest Percentage of Households Heated by Fuel Oil / Kerosene in Colorado are:
What zip code has the Highest Percentage of Households Heated by Fuel Oil / Kerosene in Colorado?
80833 has the Highest Percentage of Households Heated by Fuel Oil / Kerosene in Colorado with 45.8%.
What is the Percentage of Households Heated by Fuel Oil / Kerosene in the State of Colorado?
Percentage of Households Heated by Fuel Oil / Kerosene in Colorado is 0.10%.
What is the Percentage of Households Heated by Fuel Oil / Kerosene in the United States?
Percentage of Households Heated by Fuel Oil / Kerosene in the United States is 4.2%.