Zip Codes with the Most Immigrants from Hong Kong in Colorado
RELATED REPORTS & OPTIONS
Hong Kong
Colorado
Compare Zip Codes
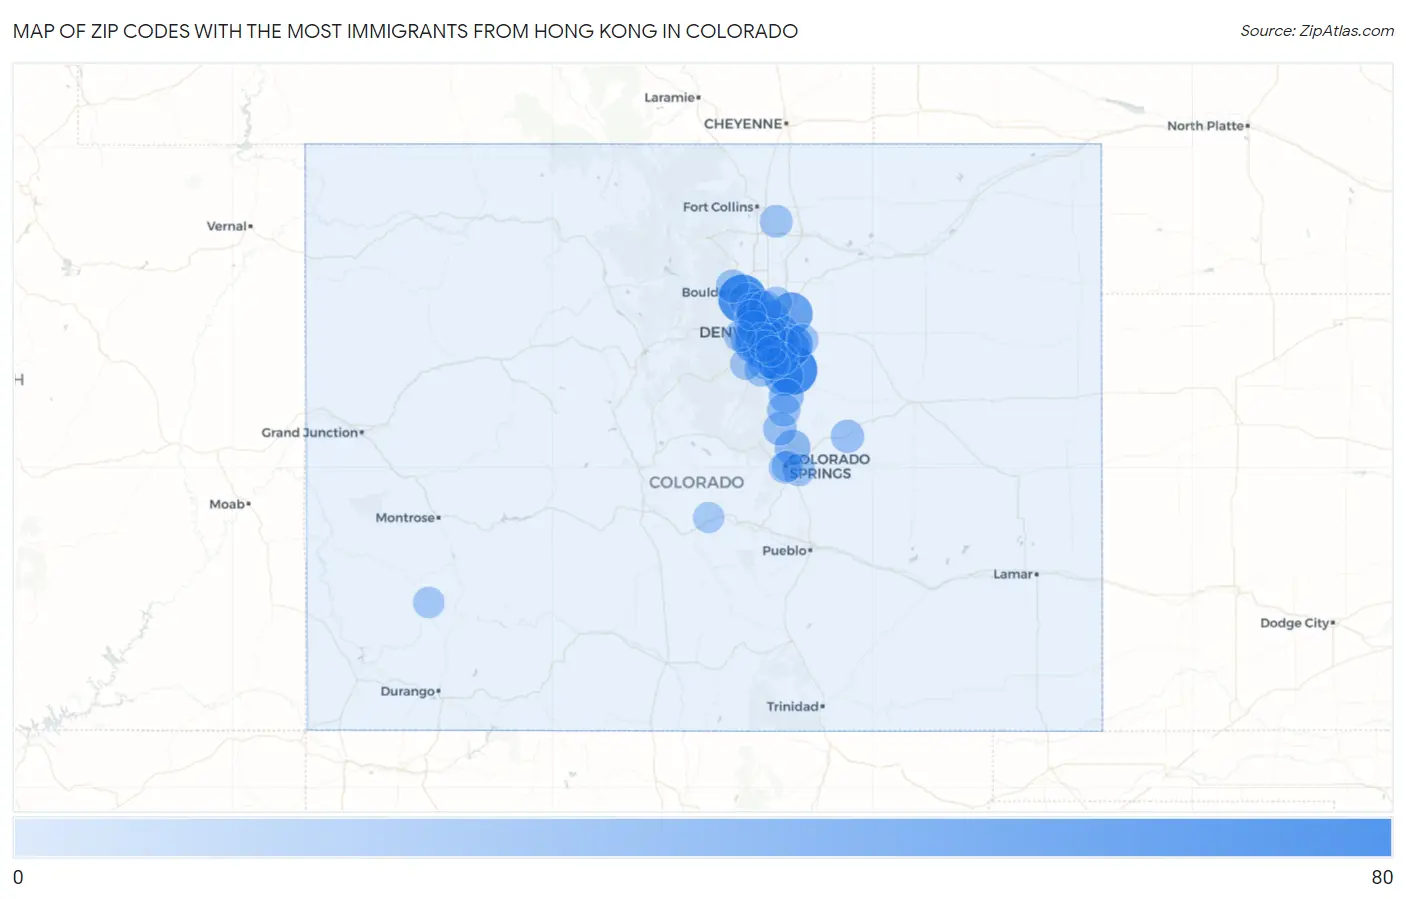
Map of Zip Codes with the Most Immigrants from Hong Kong in Colorado
0
80
Zip Codes with the Most Immigrants from Hong Kong in Colorado
| Zip Code | Hong Kong | vs State | vs National | |
| 1. | 80134 | 70 | 907(7.72%)#1 | 239,302(0.03%)#708 |
| 2. | 80303 | 66 | 907(7.28%)#2 | 239,302(0.03%)#755 |
| 3. | 80022 | 45 | 907(4.96%)#3 | 239,302(0.02%)#1,069 |
| 4. | 80230 | 44 | 907(4.85%)#4 | 239,302(0.02%)#1,124 |
| 5. | 80015 | 40 | 907(4.41%)#5 | 239,302(0.02%)#1,181 |
| 6. | 80013 | 37 | 907(4.08%)#6 | 239,302(0.02%)#1,259 |
| 7. | 80226 | 33 | 907(3.64%)#7 | 239,302(0.01%)#1,385 |
| 8. | 80247 | 33 | 907(3.64%)#8 | 239,302(0.01%)#1,389 |
| 9. | 80202 | 33 | 907(3.64%)#9 | 239,302(0.01%)#1,399 |
| 10. | 80108 | 32 | 907(3.53%)#10 | 239,302(0.01%)#1,426 |
| 11. | 80222 | 25 | 907(2.76%)#11 | 239,302(0.01%)#1,710 |
| 12. | 80129 | 20 | 907(2.21%)#12 | 239,302(0.01%)#1,940 |
| 13. | 80020 | 19 | 907(2.09%)#13 | 239,302(0.01%)#1,985 |
| 14. | 80920 | 19 | 907(2.09%)#14 | 239,302(0.01%)#1,995 |
| 15. | 80227 | 19 | 907(2.09%)#15 | 239,302(0.01%)#1,997 |
| 16. | 80231 | 19 | 907(2.09%)#16 | 239,302(0.01%)#1,999 |
| 17. | 80104 | 17 | 907(1.87%)#17 | 239,302(0.01%)#2,127 |
| 18. | 80111 | 17 | 907(1.87%)#18 | 239,302(0.01%)#2,131 |
| 19. | 80206 | 17 | 907(1.87%)#19 | 239,302(0.01%)#2,145 |
| 20. | 80014 | 16 | 907(1.76%)#20 | 239,302(0.01%)#2,203 |
| 21. | 80027 | 15 | 907(1.65%)#21 | 239,302(0.01%)#2,301 |
| 22. | 80211 | 13 | 907(1.43%)#22 | 239,302(0.01%)#2,482 |
| 23. | 80209 | 13 | 907(1.43%)#23 | 239,302(0.01%)#2,502 |
| 24. | 80004 | 12 | 907(1.32%)#24 | 239,302(0.01%)#2,569 |
| 25. | 80021 | 12 | 907(1.32%)#25 | 239,302(0.01%)#2,571 |
| 26. | 80228 | 12 | 907(1.32%)#26 | 239,302(0.01%)#2,572 |
| 27. | 80120 | 12 | 907(1.32%)#27 | 239,302(0.01%)#2,580 |
| 28. | 80132 | 12 | 907(1.32%)#28 | 239,302(0.01%)#2,585 |
| 29. | 80229 | 11 | 907(1.21%)#29 | 239,302(0.00%)#2,638 |
| 30. | 80123 | 11 | 907(1.21%)#30 | 239,302(0.00%)#2,647 |
| 31. | 80234 | 11 | 907(1.21%)#31 | 239,302(0.00%)#2,688 |
| 32. | 80033 | 11 | 907(1.21%)#32 | 239,302(0.00%)#2,694 |
| 33. | 80304 | 11 | 907(1.21%)#33 | 239,302(0.00%)#2,697 |
| 34. | 80125 | 11 | 907(1.21%)#34 | 239,302(0.00%)#2,728 |
| 35. | 80808 | 11 | 907(1.21%)#35 | 239,302(0.00%)#2,739 |
| 36. | 80118 | 11 | 907(1.21%)#36 | 239,302(0.00%)#2,740 |
| 37. | 80550 | 9 | 907(0.99%)#37 | 239,302(0.00%)#2,872 |
| 38. | 80219 | 8 | 907(0.88%)#38 | 239,302(0.00%)#2,976 |
| 39. | 80126 | 8 | 907(0.88%)#39 | 239,302(0.00%)#2,987 |
| 40. | 80916 | 8 | 907(0.88%)#40 | 239,302(0.00%)#2,998 |
| 41. | 80127 | 7 | 907(0.77%)#41 | 239,302(0.00%)#3,079 |
| 42. | 80112 | 7 | 907(0.77%)#42 | 239,302(0.00%)#3,098 |
| 43. | 80905 | 7 | 907(0.77%)#43 | 239,302(0.00%)#3,142 |
| 44. | 80130 | 6 | 907(0.66%)#44 | 239,302(0.00%)#3,239 |
| 45. | 80110 | 6 | 907(0.66%)#45 | 239,302(0.00%)#3,242 |
| 46. | 80018 | 6 | 907(0.66%)#46 | 239,302(0.00%)#3,256 |
| 47. | 80401 | 5 | 907(0.55%)#47 | 239,302(0.00%)#3,304 |
| 48. | 80602 | 5 | 907(0.55%)#48 | 239,302(0.00%)#3,306 |
| 49. | 80903 | 5 | 907(0.55%)#49 | 239,302(0.00%)#3,332 |
| 50. | 81435 | 4 | 907(0.44%)#50 | 239,302(0.00%)#3,425 |
| 51. | 81212 | 3 | 907(0.33%)#51 | 239,302(0.00%)#3,456 |
| 52. | 80121 | 2 | 907(0.22%)#52 | 239,302(0.00%)#3,519 |
| 53. | 80005 | 1 | 907(0.11%)#53 | 239,302(0.00%)#3,570 |
Common Questions
What are the Top 10 Zip Codes with the Most Immigrants from Hong Kong in Colorado?
Top 10 Zip Codes with the Most Immigrants from Hong Kong in Colorado are:
What zip code has the Most Immigrants from Hong Kong in Colorado?
80134 has the Most Immigrants from Hong Kong in Colorado with 70.
What is the Total Immigrants from Hong Kong in the State of Colorado?
Total Immigrants from Hong Kong in Colorado is 907.
What is the Total Immigrants from Hong Kong in the United States?
Total Immigrants from Hong Kong in the United States is 239,302.