Zip Codes with the Highest Percentage of Population Employed in Installation, Maintenance & Repair in Colorado
RELATED REPORTS & OPTIONS
Installation, Maintenance & Repair
Colorado
Compare Zip Codes
Map of Zip Codes with the Highest Percentage of Population Employed in Installation, Maintenance & Repair in Colorado
0.0%
50.0%
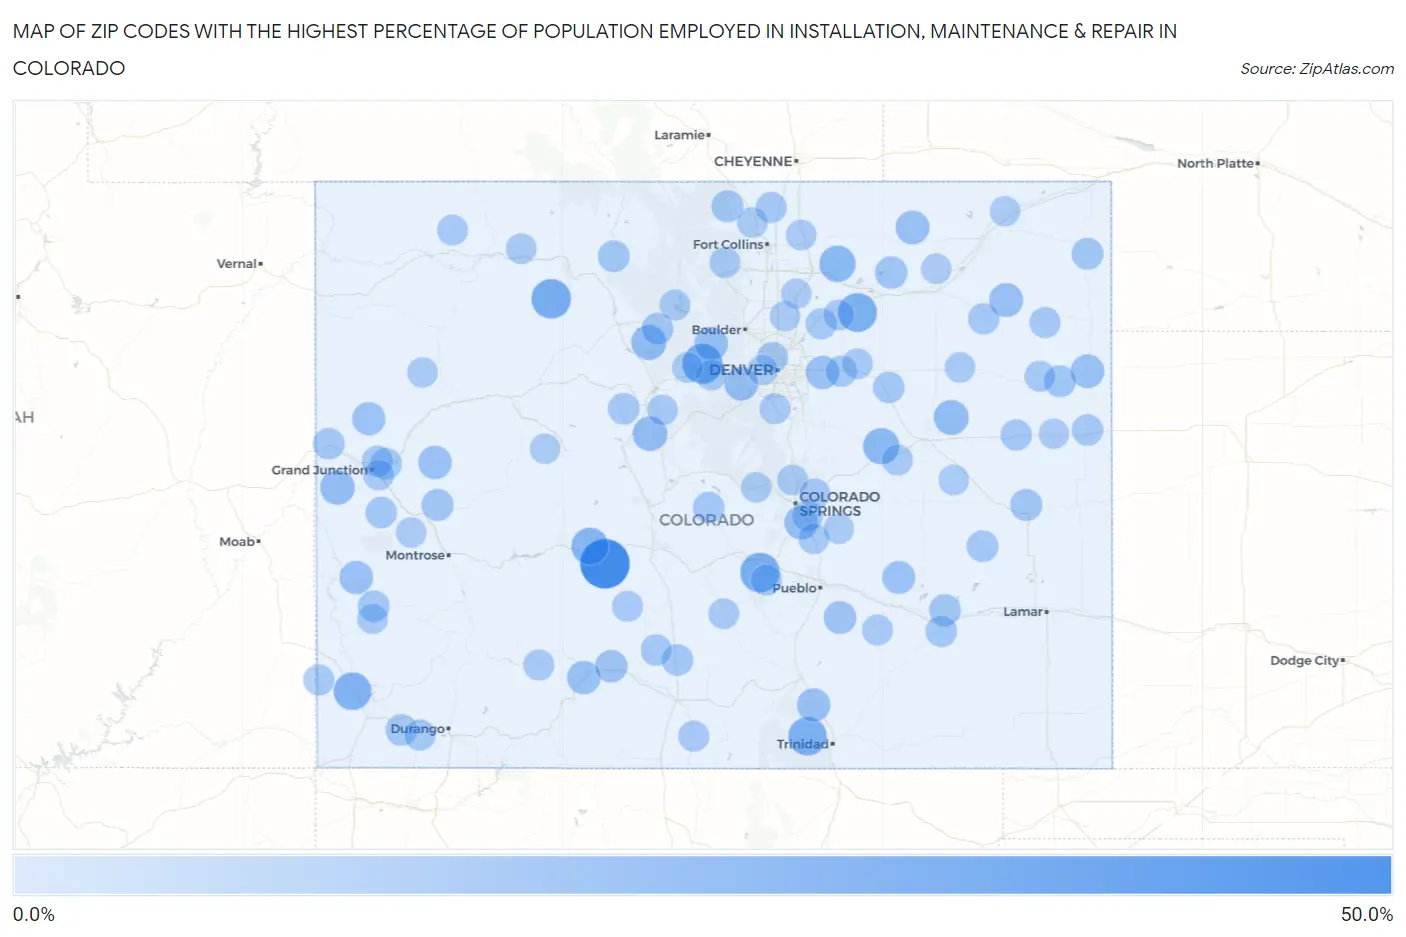
Zip Codes with the Highest Percentage of Population Employed in Installation, Maintenance & Repair in Colorado
| Zip Code | % Employed | vs State | vs National | |
| 1. | 81248 | 45.8% | 2.8% (+42.9)#1 | 3.1% (+42.7)#65 |
| 2. | 80436 | 25.6% | 2.8% (+22.8)#2 | 3.1% (+22.5)#231 |
| 3. | 80469 | 24.4% | 2.8% (+21.5)#3 | 3.1% (+21.3)#258 |
| 4. | 81221 | 24.3% | 2.8% (+21.5)#4 | 3.1% (+21.2)#259 |
| 5. | 80652 | 23.2% | 2.8% (+20.4)#5 | 3.1% (+20.1)#283 |
| 6. | 81024 | 22.2% | 2.8% (+19.4)#6 | 3.1% (+19.2)#314 |
| 7. | 81335 | 20.4% | 2.8% (+17.5)#7 | 3.1% (+17.3)#373 |
| 8. | 81239 | 19.3% | 2.8% (+16.5)#8 | 3.1% (+16.2)#425 |
| 9. | 80835 | 17.6% | 2.8% (+14.8)#9 | 3.1% (+14.6)#546 |
| 10. | 80624 | 17.5% | 2.8% (+14.7)#10 | 3.1% (+14.4)#554 |
| 11. | 80468 | 14.9% | 2.8% (+12.1)#11 | 3.1% (+11.8)#793 |
| 12. | 80818 | 14.7% | 2.8% (+11.9)#12 | 3.1% (+11.7)#808 |
| 13. | 80420 | 14.2% | 2.8% (+11.4)#13 | 3.1% (+11.1)#903 |
| 14. | 81523 | 13.9% | 2.8% (+11.1)#14 | 3.1% (+10.8)#941 |
| 15. | 80743 | 12.5% | 2.8% (+9.66)#15 | 3.1% (+9.41)#1,212 |
| 16. | 80913 | 12.4% | 2.8% (+9.58)#16 | 3.1% (+9.33)#1,227 |
| 17. | 80742 | 12.3% | 2.8% (+9.52)#17 | 3.1% (+9.28)#1,237 |
| 18. | 80457 | 12.3% | 2.8% (+9.46)#18 | 3.1% (+9.21)#1,247 |
| 19. | 80735 | 12.2% | 2.8% (+9.39)#19 | 3.1% (+9.14)#1,268 |
| 20. | 80474 | 11.9% | 2.8% (+9.05)#20 | 3.1% (+8.81)#1,355 |
| 21. | 81646 | 11.9% | 2.8% (+9.04)#21 | 3.1% (+8.80)#1,357 |
| 22. | 80137 | 11.7% | 2.8% (+8.85)#22 | 3.1% (+8.60)#1,411 |
| 23. | 81020 | 11.7% | 2.8% (+8.84)#23 | 3.1% (+8.59)#1,416 |
| 24. | 81154 | 11.5% | 2.8% (+8.69)#24 | 3.1% (+8.45)#1,450 |
| 25. | 81422 | 11.5% | 2.8% (+8.64)#25 | 3.1% (+8.39)#1,470 |
| 26. | 81630 | 11.3% | 2.8% (+8.49)#26 | 3.1% (+8.24)#1,520 |
| 27. | 81062 | 10.6% | 2.8% (+7.80)#27 | 3.1% (+7.55)#1,755 |
| 28. | 81022 | 10.3% | 2.8% (+7.50)#28 | 3.1% (+7.26)#1,875 |
| 29. | 81132 | 9.8% | 2.8% (+6.97)#29 | 3.1% (+6.73)#2,116 |
| 30. | 80653 | 9.8% | 2.8% (+6.97)#30 | 3.1% (+6.72)#2,118 |
| 31. | 80825 | 8.9% | 2.8% (+6.09)#31 | 3.1% (+5.84)#2,620 |
| 32. | 80536 | 8.8% | 2.8% (+5.95)#32 | 3.1% (+5.71)#2,711 |
| 33. | 81410 | 8.7% | 2.8% (+5.91)#33 | 3.1% (+5.67)#2,737 |
| 34. | 80824 | 8.4% | 2.8% (+5.57)#34 | 3.1% (+5.32)#2,959 |
| 35. | 80430 | 8.3% | 2.8% (+5.51)#35 | 3.1% (+5.27)#3,020 |
| 36. | 81030 | 8.3% | 2.8% (+5.51)#36 | 3.1% (+5.27)#3,021 |
| 37. | 80734 | 8.3% | 2.8% (+5.45)#37 | 3.1% (+5.20)#3,056 |
| 38. | 80451 | 8.2% | 2.8% (+5.41)#38 | 3.1% (+5.16)#3,095 |
| 39. | 81328 | 8.1% | 2.8% (+5.30)#39 | 3.1% (+5.06)#3,184 |
| 40. | 81431 | 7.9% | 2.8% (+5.08)#40 | 3.1% (+4.84)#3,408 |
| 41. | 81045 | 7.9% | 2.8% (+5.07)#41 | 3.1% (+4.83)#3,417 |
| 42. | 81525 | 7.9% | 2.8% (+5.06)#42 | 3.1% (+4.81)#3,429 |
| 43. | 81527 | 7.8% | 2.8% (+4.97)#43 | 3.1% (+4.72)#3,525 |
| 44. | 80105 | 7.7% | 2.8% (+4.92)#44 | 3.1% (+4.68)#3,579 |
| 45. | 81050 | 7.7% | 2.8% (+4.92)#45 | 3.1% (+4.67)#3,587 |
| 46. | 81649 | 7.7% | 2.8% (+4.87)#46 | 3.1% (+4.62)#3,635 |
| 47. | 80820 | 7.6% | 2.8% (+4.83)#47 | 3.1% (+4.58)#3,680 |
| 48. | 81520 | 7.6% | 2.8% (+4.77)#48 | 3.1% (+4.52)#3,738 |
| 49. | 81136 | 7.5% | 2.8% (+4.73)#49 | 3.1% (+4.48)#3,771 |
| 50. | 81125 | 7.5% | 2.8% (+4.66)#50 | 3.1% (+4.41)#3,837 |
| 51. | 80834 | 7.4% | 2.8% (+4.61)#51 | 3.1% (+4.36)#3,895 |
| 52. | 80807 | 7.4% | 2.8% (+4.60)#52 | 3.1% (+4.35)#3,915 |
| 53. | 80720 | 7.4% | 2.8% (+4.55)#53 | 3.1% (+4.31)#3,963 |
| 54. | 80102 | 7.2% | 2.8% (+4.39)#54 | 3.1% (+4.14)#4,164 |
| 55. | 80030 | 7.2% | 2.8% (+4.38)#55 | 3.1% (+4.13)#4,177 |
| 56. | 81504 | 7.1% | 2.8% (+4.31)#56 | 3.1% (+4.07)#4,256 |
| 57. | 81326 | 7.1% | 2.8% (+4.31)#57 | 3.1% (+4.06)#4,259 |
| 58. | 80549 | 7.0% | 2.8% (+4.15)#58 | 3.1% (+3.90)#4,485 |
| 59. | 80642 | 6.8% | 2.8% (+4.02)#59 | 3.1% (+3.77)#4,690 |
| 60. | 81226 | 6.8% | 2.8% (+4.00)#60 | 3.1% (+3.76)#4,704 |
| 61. | 80911 | 6.7% | 2.8% (+3.92)#61 | 3.1% (+3.67)#4,832 |
| 62. | 81324 | 6.7% | 2.8% (+3.88)#62 | 3.1% (+3.63)#4,896 |
| 63. | 80759 | 6.7% | 2.8% (+3.85)#63 | 3.1% (+3.61)#4,933 |
| 64. | 80822 | 6.6% | 2.8% (+3.75)#64 | 3.1% (+3.50)#5,092 |
| 65. | 81130 | 6.5% | 2.8% (+3.72)#65 | 3.1% (+3.47)#5,124 |
| 66. | 81151 | 6.5% | 2.8% (+3.71)#66 | 3.1% (+3.46)#5,133 |
| 67. | 80131 | 6.5% | 2.8% (+3.70)#67 | 3.1% (+3.45)#5,155 |
| 68. | 80830 | 6.5% | 2.8% (+3.70)#68 | 3.1% (+3.45)#5,157 |
| 69. | 81039 | 6.3% | 2.8% (+3.51)#69 | 3.1% (+3.27)#5,481 |
| 70. | 80535 | 6.2% | 2.8% (+3.40)#70 | 3.1% (+3.16)#5,693 |
| 71. | 81625 | 6.2% | 2.8% (+3.34)#71 | 3.1% (+3.10)#5,801 |
| 72. | 80532 | 6.1% | 2.8% (+3.30)#72 | 3.1% (+3.05)#5,869 |
| 73. | 81149 | 6.1% | 2.8% (+3.28)#73 | 3.1% (+3.04)#5,909 |
| 74. | 80446 | 6.1% | 2.8% (+3.27)#74 | 3.1% (+3.02)#5,931 |
| 75. | 80643 | 6.1% | 2.8% (+3.24)#75 | 3.1% (+2.99)#5,996 |
| 76. | 80452 | 6.0% | 2.8% (+3.22)#76 | 3.1% (+2.98)#6,027 |
| 77. | 80438 | 6.0% | 2.8% (+3.18)#77 | 3.1% (+2.93)#6,121 |
| 78. | 80136 | 6.0% | 2.8% (+3.15)#78 | 3.1% (+2.91)#6,190 |
| 79. | 81252 | 6.0% | 2.8% (+3.15)#79 | 3.1% (+2.90)#6,202 |
| 80. | 80840 | 5.9% | 2.8% (+3.12)#80 | 3.1% (+2.88)#6,260 |
| 81. | 80817 | 5.9% | 2.8% (+3.11)#81 | 3.1% (+2.86)#6,295 |
| 82. | 80938 | 5.9% | 2.8% (+3.08)#82 | 3.1% (+2.84)#6,338 |
| 83. | 81639 | 5.9% | 2.8% (+3.07)#83 | 3.1% (+2.83)#6,353 |
| 84. | 81503 | 5.9% | 2.8% (+3.06)#84 | 3.1% (+2.82)#6,375 |
| 85. | 80928 | 5.8% | 2.8% (+3.00)#85 | 3.1% (+2.75)#6,511 |
| 86. | 80424 | 5.8% | 2.8% (+2.98)#86 | 3.1% (+2.73)#6,560 |
| 87. | 81650 | 5.8% | 2.8% (+2.97)#87 | 3.1% (+2.72)#6,574 |
| 88. | 80650 | 5.8% | 2.8% (+2.97)#88 | 3.1% (+2.72)#6,578 |
| 89. | 81423 | 5.8% | 2.8% (+2.97)#89 | 3.1% (+2.72)#6,587 |
| 90. | 80740 | 5.8% | 2.8% (+2.95)#90 | 3.1% (+2.70)#6,643 |
| 91. | 81416 | 5.8% | 2.8% (+2.93)#91 | 3.1% (+2.69)#6,664 |
| 92. | 80814 | 5.7% | 2.8% (+2.91)#92 | 3.1% (+2.67)#6,716 |
| 93. | 80530 | 5.7% | 2.8% (+2.87)#93 | 3.1% (+2.62)#6,803 |
| 94. | 80750 | 5.7% | 2.8% (+2.86)#94 | 3.1% (+2.61)#6,824 |
| 95. | 80651 | 5.7% | 2.8% (+2.83)#95 | 3.1% (+2.59)#6,883 |
| 96. | 80821 | 5.6% | 2.8% (+2.76)#96 | 3.1% (+2.52)#7,054 |
| 97. | 81654 | 5.5% | 2.8% (+2.71)#97 | 3.1% (+2.46)#7,191 |
| 98. | 80215 | 5.4% | 2.8% (+2.60)#98 | 3.1% (+2.36)#7,473 |
| 99. | 80736 | 5.4% | 2.8% (+2.55)#99 | 3.1% (+2.31)#7,594 |
| 100. | 80836 | 5.3% | 2.8% (+2.53)#100 | 3.1% (+2.28)#7,685 |
Common Questions
What are the Top 10 Zip Codes with the Highest Percentage of Population Employed in Installation, Maintenance & Repair in Colorado?
Top 10 Zip Codes with the Highest Percentage of Population Employed in Installation, Maintenance & Repair in Colorado are:
What zip code has the Highest Percentage of Population Employed in Installation, Maintenance & Repair in Colorado?
81248 has the Highest Percentage of Population Employed in Installation, Maintenance & Repair in Colorado with 45.8%.
What is the Percentage of Population Employed in Installation, Maintenance & Repair in the State of Colorado?
Percentage of Population Employed in Installation, Maintenance & Repair in Colorado is 2.8%.
What is the Percentage of Population Employed in Installation, Maintenance & Repair in the United States?
Percentage of Population Employed in Installation, Maintenance & Repair in the United States is 3.1%.