Zip Codes with the Highest Percentage of Population Employed in Legal Services & Support in Colorado
RELATED REPORTS & OPTIONS
Legal Services & Support
Colorado
Compare Zip Codes
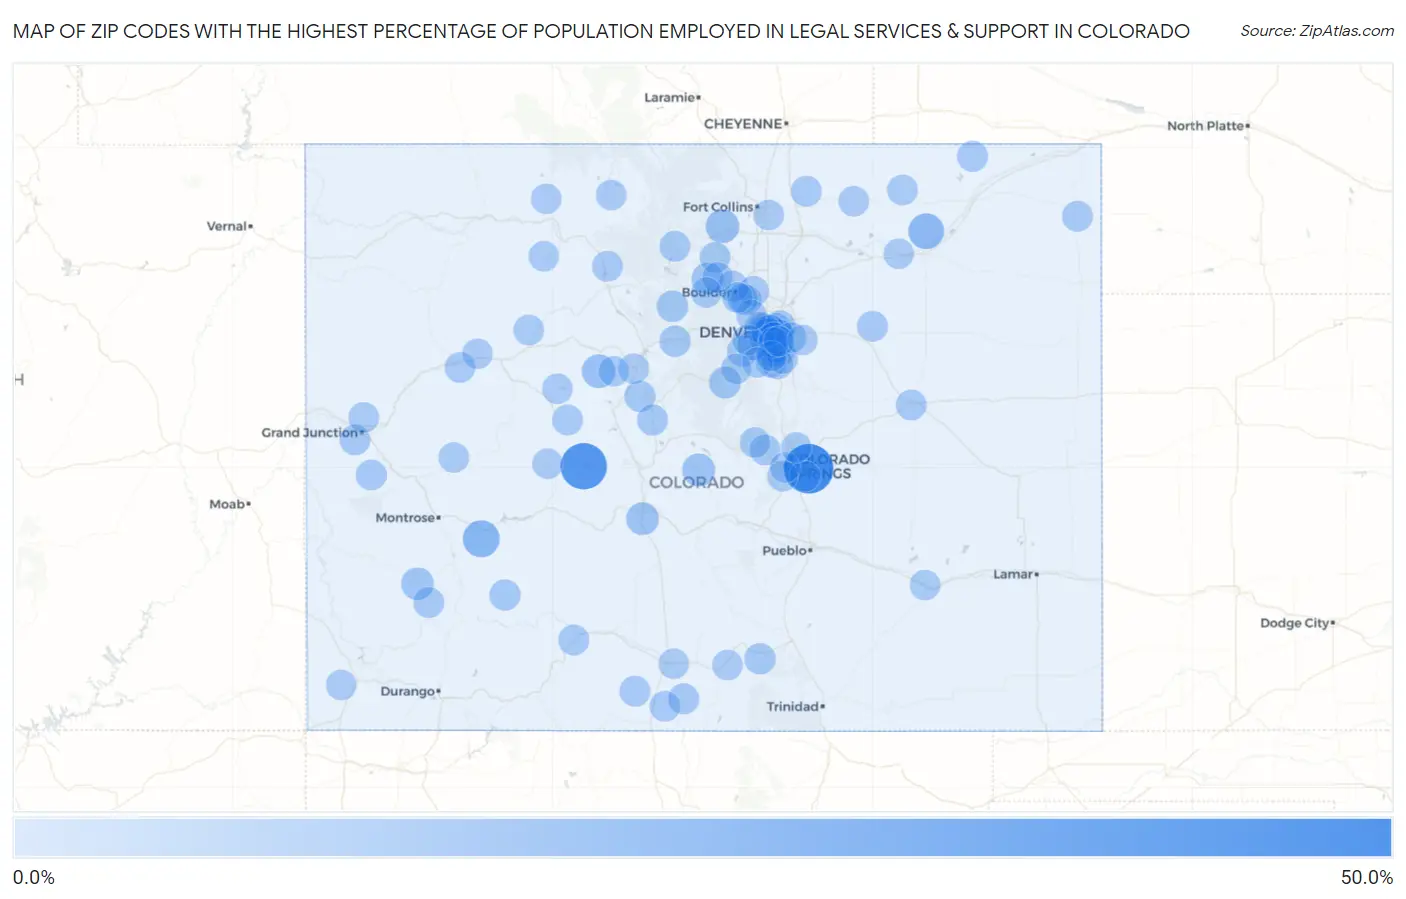
Map of Zip Codes with the Highest Percentage of Population Employed in Legal Services & Support in Colorado
0.0%
50.0%
Zip Codes with the Highest Percentage of Population Employed in Legal Services & Support in Colorado
| Zip Code | % Employed | vs State | vs National | |
| 1. | 80929 | 50.0% | 1.2%(+48.8)#1 | 1.2%(+48.8)#8 |
| 2. | 81210 | 41.7% | 1.2%(+40.6)#2 | 1.2%(+40.6)#12 |
| 3. | 81220 | 17.5% | 1.2%(+16.3)#3 | 1.2%(+16.3)#63 |
| 4. | 80290 | 15.4% | 1.2%(+14.2)#4 | 1.2%(+14.2)#77 |
| 5. | 80750 | 14.8% | 1.2%(+13.6)#5 | 1.2%(+13.6)#83 |
| 6. | 81645 | 9.6% | 1.2%(+8.37)#6 | 1.2%(+8.37)#172 |
| 7. | 80515 | 9.2% | 1.2%(+8.04)#7 | 1.2%(+8.04)#186 |
| 8. | 80820 | 7.6% | 1.2%(+6.46)#8 | 1.2%(+6.46)#291 |
| 9. | 81242 | 7.3% | 1.2%(+6.07)#9 | 1.2%(+6.07)#318 |
| 10. | 81430 | 6.7% | 1.2%(+5.51)#10 | 1.2%(+5.51)#377 |
| 11. | 80470 | 5.2% | 1.2%(+4.01)#11 | 1.2%(+4.01)#665 |
| 12. | 80481 | 5.2% | 1.2%(+3.97)#12 | 1.2%(+3.97)#680 |
| 13. | 80206 | 4.7% | 1.2%(+3.55)#13 | 1.2%(+3.55)#799 |
| 14. | 80210 | 4.6% | 1.2%(+3.38)#14 | 1.2%(+3.38)#871 |
| 15. | 80482 | 4.1% | 1.2%(+2.95)#15 | 1.2%(+2.95)#1,056 |
| 16. | 80220 | 4.1% | 1.2%(+2.91)#16 | 1.2%(+2.92)#1,079 |
| 17. | 80476 | 3.9% | 1.2%(+2.70)#17 | 1.2%(+2.70)#1,185 |
| 18. | 80238 | 3.9% | 1.2%(+2.69)#18 | 1.2%(+2.69)#1,189 |
| 19. | 81055 | 3.6% | 1.2%(+2.44)#19 | 1.2%(+2.44)#1,334 |
| 20. | 80207 | 3.6% | 1.2%(+2.37)#20 | 1.2%(+2.37)#1,384 |
| 21. | 80209 | 3.5% | 1.2%(+2.27)#21 | 1.2%(+2.27)#1,466 |
| 22. | 80230 | 3.4% | 1.2%(+2.22)#22 | 1.2%(+2.22)#1,505 |
| 23. | 81235 | 3.4% | 1.2%(+2.21)#23 | 1.2%(+2.21)#1,506 |
| 24. | 80420 | 3.4% | 1.2%(+2.18)#24 | 1.2%(+2.18)#1,520 |
| 25. | 80218 | 3.1% | 1.2%(+1.93)#25 | 1.2%(+1.93)#1,736 |
| 26. | 80440 | 3.1% | 1.2%(+1.91)#26 | 1.2%(+1.91)#1,760 |
| 27. | 80304 | 3.0% | 1.2%(+1.77)#27 | 1.2%(+1.77)#1,900 |
| 28. | 80211 | 2.9% | 1.2%(+1.72)#28 | 1.2%(+1.72)#1,970 |
| 29. | 80747 | 2.8% | 1.2%(+1.66)#29 | 1.2%(+1.66)#2,025 |
| 30. | 81140 | 2.8% | 1.2%(+1.57)#30 | 1.2%(+1.57)#2,124 |
| 31. | 81151 | 2.7% | 1.2%(+1.54)#31 | 1.2%(+1.54)#2,175 |
| 32. | 80465 | 2.7% | 1.2%(+1.53)#32 | 1.2%(+1.53)#2,184 |
| 33. | 80223 | 2.6% | 1.2%(+1.43)#33 | 1.2%(+1.43)#2,323 |
| 34. | 80212 | 2.6% | 1.2%(+1.43)#34 | 1.2%(+1.43)#2,337 |
| 35. | 80111 | 2.6% | 1.2%(+1.42)#35 | 1.2%(+1.42)#2,343 |
| 36. | 81611 | 2.6% | 1.2%(+1.40)#36 | 1.2%(+1.40)#2,380 |
| 37. | 81154 | 2.6% | 1.2%(+1.37)#37 | 1.2%(+1.37)#2,422 |
| 38. | 80121 | 2.5% | 1.2%(+1.36)#38 | 1.2%(+1.36)#2,443 |
| 39. | 80113 | 2.5% | 1.2%(+1.34)#39 | 1.2%(+1.34)#2,468 |
| 40. | 80734 | 2.5% | 1.2%(+1.34)#40 | 1.2%(+1.34)#2,477 |
| 41. | 80103 | 2.5% | 1.2%(+1.32)#41 | 1.2%(+1.32)#2,501 |
| 42. | 80540 | 2.5% | 1.2%(+1.29)#42 | 1.2%(+1.29)#2,557 |
| 43. | 80742 | 2.5% | 1.2%(+1.28)#43 | 1.2%(+1.29)#2,568 |
| 44. | 80459 | 2.5% | 1.2%(+1.28)#44 | 1.2%(+1.28)#2,572 |
| 45. | 80203 | 2.5% | 1.2%(+1.28)#45 | 1.2%(+1.28)#2,573 |
| 46. | 80124 | 2.4% | 1.2%(+1.26)#46 | 1.2%(+1.26)#2,608 |
| 47. | 81435 | 2.4% | 1.2%(+1.23)#47 | 1.2%(+1.23)#2,657 |
| 48. | 80447 | 2.4% | 1.2%(+1.22)#48 | 1.2%(+1.22)#2,670 |
| 49. | 80202 | 2.4% | 1.2%(+1.20)#49 | 1.2%(+1.21)#2,697 |
| 50. | 80925 | 2.4% | 1.2%(+1.19)#50 | 1.2%(+1.19)#2,720 |
| 51. | 80610 | 2.3% | 1.2%(+1.16)#51 | 1.2%(+1.16)#2,769 |
| 52. | 80828 | 2.3% | 1.2%(+1.14)#52 | 1.2%(+1.14)#2,797 |
| 53. | 80237 | 2.3% | 1.2%(+1.13)#53 | 1.2%(+1.13)#2,819 |
| 54. | 80205 | 2.3% | 1.2%(+1.12)#54 | 1.2%(+1.12)#2,847 |
| 55. | 80027 | 2.3% | 1.2%(+1.07)#55 | 1.2%(+1.07)#2,925 |
| 56. | 81652 | 2.2% | 1.2%(+1.05)#56 | 1.2%(+1.05)#2,972 |
| 57. | 81527 | 2.2% | 1.2%(+1.03)#57 | 1.2%(+1.03)#3,020 |
| 58. | 80227 | 2.2% | 1.2%(+1.02)#58 | 1.2%(+1.02)#3,031 |
| 59. | 81507 | 2.2% | 1.2%(+0.989)#59 | 1.2%(+0.989)#3,087 |
| 60. | 80819 | 2.2% | 1.2%(+0.979)#60 | 1.2%(+0.980)#3,111 |
| 61. | 81141 | 2.1% | 1.2%(+0.960)#61 | 1.2%(+0.960)#3,151 |
| 62. | 80455 | 2.1% | 1.2%(+0.917)#62 | 1.2%(+0.917)#3,225 |
| 63. | 81637 | 2.1% | 1.2%(+0.890)#63 | 1.2%(+0.891)#3,278 |
| 64. | 80126 | 2.0% | 1.2%(+0.840)#64 | 1.2%(+0.840)#3,407 |
| 65. | 80026 | 2.0% | 1.2%(+0.829)#65 | 1.2%(+0.830)#3,440 |
| 66. | 80480 | 2.0% | 1.2%(+0.827)#66 | 1.2%(+0.827)#3,451 |
| 67. | 80303 | 2.0% | 1.2%(+0.823)#67 | 1.2%(+0.824)#3,464 |
| 68. | 80906 | 2.0% | 1.2%(+0.779)#68 | 1.2%(+0.779)#3,570 |
| 69. | 80228 | 2.0% | 1.2%(+0.772)#69 | 1.2%(+0.772)#3,585 |
| 70. | 81077 | 1.9% | 1.2%(+0.749)#70 | 1.2%(+0.750)#3,644 |
| 71. | 81506 | 1.9% | 1.2%(+0.737)#71 | 1.2%(+0.738)#3,669 |
| 72. | 80905 | 1.9% | 1.2%(+0.717)#72 | 1.2%(+0.717)#3,732 |
| 73. | 80443 | 1.9% | 1.2%(+0.700)#73 | 1.2%(+0.700)#3,771 |
| 74. | 81133 | 1.9% | 1.2%(+0.679)#74 | 1.2%(+0.680)#3,828 |
| 75. | 81224 | 1.9% | 1.2%(+0.676)#75 | 1.2%(+0.677)#3,839 |
| 76. | 81419 | 1.8% | 1.2%(+0.648)#76 | 1.2%(+0.649)#3,911 |
| 77. | 81621 | 1.8% | 1.2%(+0.643)#77 | 1.2%(+0.644)#3,920 |
| 78. | 80924 | 1.8% | 1.2%(+0.642)#78 | 1.2%(+0.642)#3,922 |
| 79. | 80547 | 1.8% | 1.2%(+0.616)#79 | 1.2%(+0.616)#4,006 |
| 80. | 80611 | 1.8% | 1.2%(+0.611)#80 | 1.2%(+0.611)#4,023 |
| 81. | 80112 | 1.8% | 1.2%(+0.600)#81 | 1.2%(+0.600)#4,045 |
| 82. | 80005 | 1.8% | 1.2%(+0.596)#82 | 1.2%(+0.597)#4,053 |
| 83. | 80466 | 1.8% | 1.2%(+0.582)#83 | 1.2%(+0.583)#4,092 |
| 84. | 80246 | 1.7% | 1.2%(+0.562)#84 | 1.2%(+0.562)#4,154 |
| 85. | 80467 | 1.7% | 1.2%(+0.554)#85 | 1.2%(+0.554)#4,181 |
| 86. | 80017 | 1.7% | 1.2%(+0.545)#86 | 1.2%(+0.545)#4,213 |
| 87. | 80222 | 1.7% | 1.2%(+0.529)#87 | 1.2%(+0.530)#4,280 |
| 88. | 81101 | 1.7% | 1.2%(+0.499)#88 | 1.2%(+0.499)#4,366 |
| 89. | 80128 | 1.7% | 1.2%(+0.497)#89 | 1.2%(+0.498)#4,371 |
| 90. | 80305 | 1.7% | 1.2%(+0.491)#90 | 1.2%(+0.492)#4,401 |
| 91. | 80433 | 1.7% | 1.2%(+0.468)#91 | 1.2%(+0.468)#4,479 |
| 92. | 81649 | 1.6% | 1.2%(+0.464)#92 | 1.2%(+0.465)#4,494 |
| 93. | 80487 | 1.6% | 1.2%(+0.461)#93 | 1.2%(+0.461)#4,501 |
| 94. | 81321 | 1.6% | 1.2%(+0.460)#94 | 1.2%(+0.460)#4,503 |
| 95. | 80122 | 1.6% | 1.2%(+0.416)#95 | 1.2%(+0.416)#4,675 |
| 96. | 80231 | 1.6% | 1.2%(+0.411)#96 | 1.2%(+0.411)#4,693 |
| 97. | 80863 | 1.6% | 1.2%(+0.402)#97 | 1.2%(+0.403)#4,726 |
| 98. | 80705 | 1.6% | 1.2%(+0.385)#98 | 1.2%(+0.386)#4,784 |
| 99. | 81647 | 1.6% | 1.2%(+0.371)#99 | 1.2%(+0.371)#4,824 |
| 100. | 80018 | 1.6% | 1.2%(+0.369)#100 | 1.2%(+0.369)#4,834 |
Common Questions
What are the Top 10 Zip Codes with the Highest Percentage of Population Employed in Legal Services & Support in Colorado?
Top 10 Zip Codes with the Highest Percentage of Population Employed in Legal Services & Support in Colorado are:
What zip code has the Highest Percentage of Population Employed in Legal Services & Support in Colorado?
80929 has the Highest Percentage of Population Employed in Legal Services & Support in Colorado with 50.0%.
What is the Percentage of Population Employed in Legal Services & Support in the State of Colorado?
Percentage of Population Employed in Legal Services & Support in Colorado is 1.2%.
What is the Percentage of Population Employed in Legal Services & Support in the United States?
Percentage of Population Employed in Legal Services & Support in the United States is 1.2%.