Zip Codes with the Lowest Percentage of Births to Unmarried Women under the Age of under 20 in Colorado

RELATED REPORTS & OPTIONS

Lowest Illegitimacy | Women 15-19
Population
Families and Households
Female Fertility
Female Fertility (Unmarried)
Race (Community Size)
Race (Percentage)
Ancestry (Community Size)
AfghanAfricanAlaska NativeAlaskan AthabascanAlbanianAleutAlsatianAmericanApacheArabArapahoArgentineanArmenianAssyrian / Chaldean / SyriacAustralianAustrianBahamianBangladeshiBarbadianBasqueBelgianBelizeanBermudanBhutaneseBlackfeetBolivianBrazilianBritishBritish West IndianBulgarianBurmeseCajunCambodianCanadianCape VerdeanCarpatho RusynCelticCentral AmericanCentral American IndianCherokeeCheyenneChickasawChileanChineseChippewaChoctawColombianColvilleComancheCosta RicanCreeCreekCroatianCrowCubanCypriotCzechCzechoslovakianDanishDelawareDominicanDutchDutch West IndianEastern EuropeanEcuadorianEgyptianEnglishEstonianEthiopianEuropeanFijianFilipinoFinnishFrenchFrench American IndianFrench CanadianGermanGerman RussianGhanaianGreekGuamanian / ChamorroGuatemalanGuyaneseHaitianHmongHonduranHopiHoumaHungarianIcelanderIndian (Asian)IndonesianInupiatIranianIraqiIrishIroquoisIsraeliItalianJamaicanJapaneseJordanianKenyanKiowaKoreanLaotianLatvianLebaneseLiberianLithuanianLumbeeLuxembourgerMacedonianMalaysianMalteseMarshalleseMenomineeMexicanMexican American IndianMongolianMoroccanNative HawaiianNavajoNepaleseNew ZealanderNicaraguanNigerianNorthern EuropeanNorwegianOkinawanOsageOttawaPaiutePakistaniPalestinianPanamanianParaguayanPennsylvania GermanPeruvianPimaPolishPortuguesePotawatomiPuebloPuerto RicanPuget Sound SalishRomanianRussianSalvadoranSamoanScandinavianScotch-IrishScottishSeminoleSenegaleseSerbianShoshoneSierra LeoneanSiouxSlavicSlovakSloveneSomaliSouth AfricanSouth AmericanSouth American IndianSoviet UnionSpaniardSpanishSpanish AmericanSpanish American IndianSri LankanSubsaharan AfricanSudaneseSwedishSwissSyrianTaiwaneseThaiTlingit-HaidaTohono O'OdhamTonganTrinidadian and TobagonianTsimshianTurkishU.S. Virgin IslanderUgandanUkrainianUruguayanUteVenezuelanVietnameseWelshWest IndianYakamaYaquiYugoslavianYumanYup'ikZimbabwean
Ancestry (Percentage)
AfghanAfricanAlaska NativeAlaskan AthabascanAlbanianAleutAlsatianAmericanApacheArabArapahoArgentineanArmenianAssyrian / Chaldean / SyriacAustralianAustrianBahamianBangladeshiBarbadianBasqueBelgianBelizeanBermudanBhutaneseBlackfeetBolivianBrazilianBritishBritish West IndianBulgarianBurmeseCajunCambodianCanadianCape VerdeanCarpatho RusynCelticCentral AmericanCentral American IndianCherokeeCheyenneChickasawChileanChineseChippewaChoctawColombianColvilleComancheCosta RicanCreeCreekCroatianCrowCubanCypriotCzechCzechoslovakianDanishDelawareDominicanDutchDutch West IndianEastern EuropeanEcuadorianEgyptianEnglishEstonianEthiopianEuropeanFijianFilipinoFinnishFrenchFrench American IndianFrench CanadianGermanGerman RussianGhanaianGreekGuamanian / ChamorroGuatemalanGuyaneseHaitianHmongHonduranHopiHoumaHungarianIcelanderIndian (Asian)IndonesianInupiatIranianIraqiIrishIroquoisIsraeliItalianJamaicanJapaneseJordanianKenyanKiowaKoreanLaotianLatvianLebaneseLiberianLithuanianLumbeeLuxembourgerMacedonianMalaysianMalteseMarshalleseMenomineeMexicanMexican American IndianMongolianMoroccanNative HawaiianNavajoNepaleseNew ZealanderNicaraguanNigerianNorthern EuropeanNorwegianOkinawanOsageOttawaPaiutePakistaniPalestinianPanamanianParaguayanPennsylvania GermanPeruvianPimaPolishPortuguesePotawatomiPuebloPuerto RicanPuget Sound SalishRomanianRussianSalvadoranSamoanScandinavianScotch-IrishScottishSeminoleSenegaleseSerbianShoshoneSierra LeoneanSiouxSlavicSlovakSloveneSomaliSouth AfricanSouth AmericanSouth American IndianSoviet UnionSpaniardSpanishSpanish AmericanSpanish American IndianSri LankanSubsaharan AfricanSudaneseSwedishSwissSyrianTaiwaneseThaiTlingit-HaidaTohono O'OdhamTonganTrinidadian and TobagonianTsimshianTurkishU.S. Virgin IslanderUgandanUkrainianUruguayanUteVenezuelanVietnameseWelshWest IndianYakamaYaquiYugoslavianYumanYup'ikZimbabwean
Immigrant Origin (Total)
AfghanistanAfricaAlbaniaArgentinaArmeniaAsiaAustraliaAustriaAzoresBahamasBangladeshBarbadosBelarusBelgiumBelizeBoliviaBosnia and HerzegovinaBrazilBulgariaBurma / MyanmarCabo VerdeCambodiaCameroonCanadaCaribbeanCentral AmericaChileChinaColombiaCongoCosta RicaCroatiaCubaCzechoslovakiaDenmarkDominicaDominican RepublicEastern AfricaEastern AsiaEastern EuropeEcuadorEgyptEl SalvadorEnglandEritreaEthiopiaEuropeFijiFranceGermanyGhanaGreeceGrenadaGuatemalaGuyanaHaitiHondurasHong KongHungaryIndiaIndonesiaIranIraqIrelandIsraelItalyJamaicaJapanJordanKazakhstanKenyaKoreaKuwaitLaosLatin AmericaLatviaLebanonLiberiaLithuaniaMalaysiaMexicoMicronesiaMiddle AfricaMoldovaMoroccoNepalNetherlandsNicaraguaNigeriaNorth MacedoniaNorthern AfricaNorthern EuropeNorwayOceaniaPakistanPanamaPeruPhilippinesPolandPortugalRomaniaRussiaSaudi ArabiaScotlandSenegalSerbiaSierra LeoneSingaporeSomaliaSouth AfricaSouth AmericaSouth Central AsiaSouth Eastern AsiaSouthern EuropeSpainSri LankaSt. Vincent and the GrenadinesSudanSwedenSwitzerlandSyriaTaiwanThailandTrinidad and TobagoTurkeyUgandaUkraineUruguayUzbekistanVenezuelaVietnamWest IndiesWestern AfricaWestern AsiaWestern EuropeYemenZaireZimbabwe
Immigrant Origin (Percentage)
AfghanistanAfricaAlbaniaArgentinaArmeniaAsiaAustraliaAustriaAzoresBahamasBangladeshBarbadosBelarusBelgiumBelizeBoliviaBosnia and HerzegovinaBrazilBulgariaBurma / MyanmarCabo VerdeCambodiaCameroonCanadaCaribbeanCentral AmericaChileChinaColombiaCongoCosta RicaCroatiaCubaCzechoslovakiaDenmarkDominicaDominican RepublicEastern AfricaEastern AsiaEastern EuropeEcuadorEgyptEl SalvadorEnglandEritreaEthiopiaEuropeFijiFranceGermanyGhanaGreeceGrenadaGuatemalaGuyanaHaitiHondurasHong KongHungaryIndiaIndonesiaIranIraqIrelandIsraelItalyJamaicaJapanJordanKazakhstanKenyaKoreaKuwaitLaosLatin AmericaLatviaLebanonLiberiaLithuaniaMalaysiaMexicoMicronesiaMiddle AfricaMoldovaMoroccoNepalNetherlandsNicaraguaNigeriaNorth MacedoniaNorthern AfricaNorthern EuropeNorwayOceaniaPakistanPanamaPeruPhilippinesPolandPortugalRomaniaRussiaSaudi ArabiaScotlandSenegalSerbiaSierra LeoneSingaporeSomaliaSouth AfricaSouth AmericaSouth Central AsiaSouth Eastern AsiaSouthern EuropeSpainSri LankaSt. Vincent and the GrenadinesSudanSwedenSwitzerlandSyriaTaiwanThailandTrinidad and TobagoTurkeyUgandaUkraineUruguayUzbekistanVenezuelaVietnamWest IndiesWestern AfricaWestern AsiaWestern EuropeYemenZaireZimbabwe
Income
Income (Families)
Income (Households)
Poverty
Poverty (Families)
Unemployment
Employment Occupations
Employment Industries
Employer Class
Commute Time
Commute Means
School Enrollment
Education by Degree Field
Occupancy
Finances
Physical Characteristics
Colorado
Compare Zip Codes
Comparison Subject

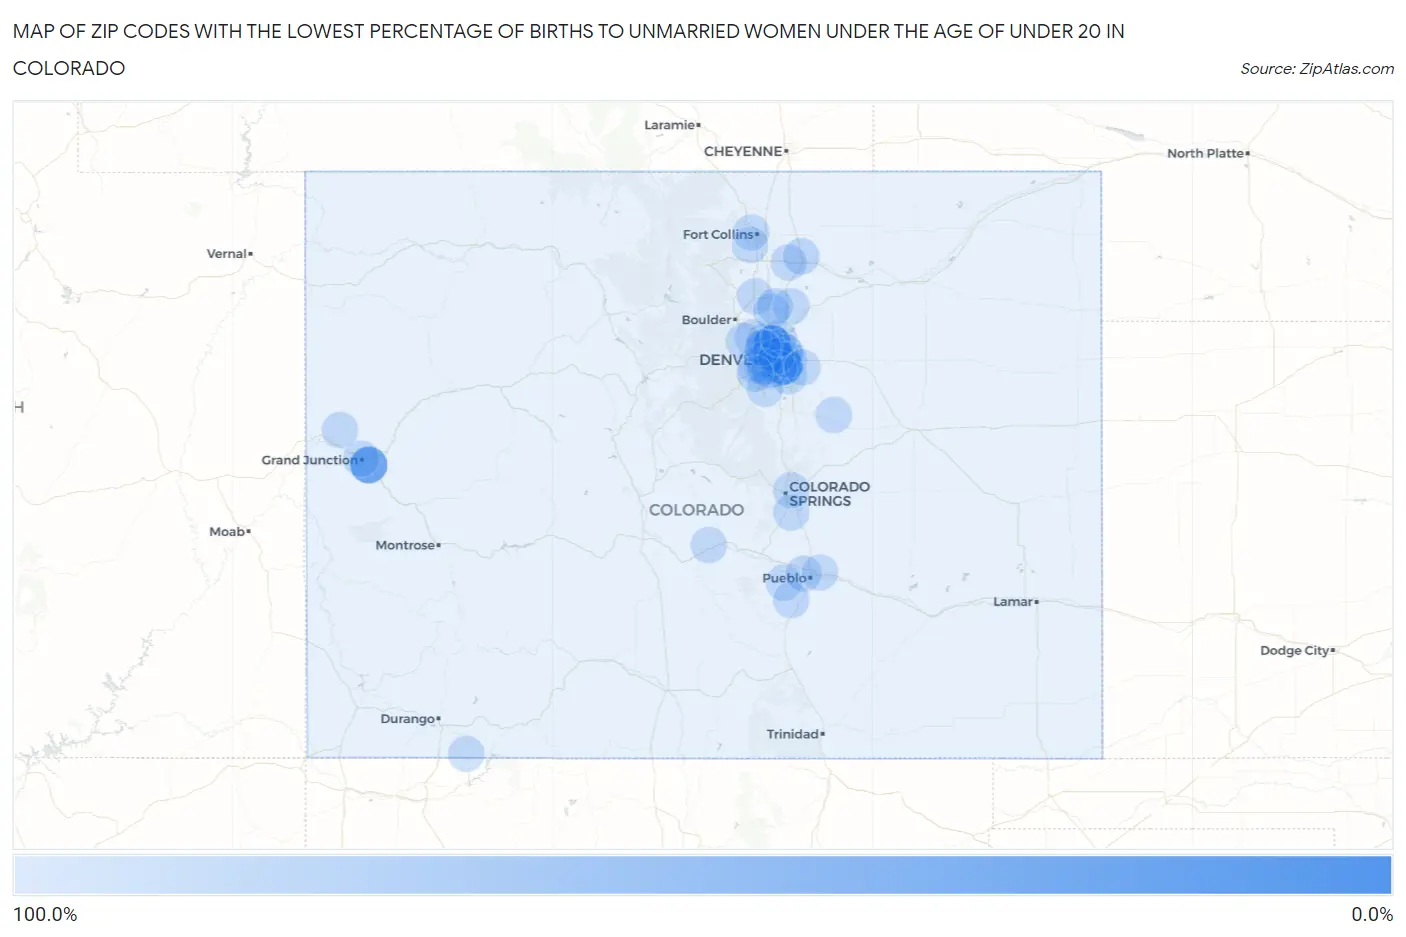
Map of Zip Codes with the Lowest Percentage of Births to Unmarried Women under the Age of under 20 in Colorado

100.0%
0.0%
Zip Codes with the Lowest Percentage of Births to Unmarried Women under the Age of under 20 in Colorado Map

Zip Codes with the Lowest Percentage of Births to Unmarried Women under the Age of under 20 in Colorado

Zip Code % Unmarried vs State vs National
1.8022916.4%79.5%(-63.1)#186.9%(-70.5)#12
2.8001219.4%79.5%(-60.1)#286.9%(-67.5)#17
3.8150335.3%79.5%(-44.2)#386.9%(-51.6)#47
4.8021650.0%79.5%(-29.5)#486.9%(-36.9)#85
5.8023972.1%79.5%(-7.40)#586.9%(-14.8)#158
6.8001090.3%79.5%(+10.8)#686.9%(+3.40)#219
7.8063196.1%79.5%(+16.6)#786.9%(+9.20)#228
8.80015100.0%79.5%(+20.5)#886.9%(+13.1)#305
9.80219100.0%79.5%(+20.5)#986.9%(+13.1)#364
10.80634100.0%79.5%(+20.5)#1086.9%(+13.1)#402
11.80011100.0%79.5%(+20.5)#1186.9%(+13.1)#528
12.80526100.0%79.5%(+20.5)#1286.9%(+13.1)#716
13.80501100.0%79.5%(+20.5)#1386.9%(+13.1)#749
14.80221100.0%79.5%(+20.5)#1486.9%(+13.1)#867
15.80521100.0%79.5%(+20.5)#1586.9%(+13.1)#958
16.80210100.0%79.5%(+20.5)#1686.9%(+13.1)#972
17.80909100.0%79.5%(+20.5)#1786.9%(+13.1)#1,000
18.80260100.0%79.5%(+20.5)#1886.9%(+13.1)#1,081
19.80021100.0%79.5%(+20.5)#1986.9%(+13.1)#1,085
20.80204100.0%79.5%(+20.5)#2086.9%(+13.1)#1,110
21.80231100.0%79.5%(+20.5)#2186.9%(+13.1)#1,112
22.81212100.0%79.5%(+20.5)#2286.9%(+13.1)#1,208
23.80226100.0%79.5%(+20.5)#2386.9%(+13.1)#1,213
24.81005100.0%79.5%(+20.5)#2486.9%(+13.1)#1,233
25.81001100.0%79.5%(+20.5)#2586.9%(+13.1)#1,250
26.80129100.0%79.5%(+20.5)#2686.9%(+13.1)#1,299
27.81004100.0%79.5%(+20.5)#2786.9%(+13.1)#1,501
28.81501100.0%79.5%(+20.5)#2886.9%(+13.1)#1,631
29.80207100.0%79.5%(+20.5)#2986.9%(+13.1)#1,726
30.80223100.0%79.5%(+20.5)#3086.9%(+13.1)#1,854
31.80007100.0%79.5%(+20.5)#3186.9%(+13.1)#1,954
32.80030100.0%79.5%(+20.5)#3286.9%(+13.1)#1,986
33.80018100.0%79.5%(+20.5)#3386.9%(+13.1)#2,068
34.81003100.0%79.5%(+20.5)#3486.9%(+13.1)#2,108
35.80621100.0%79.5%(+20.5)#3586.9%(+13.1)#2,160
36.80640100.0%79.5%(+20.5)#3686.9%(+13.1)#2,173
37.80235100.0%79.5%(+20.5)#3786.9%(+13.1)#2,481
38.80913100.0%79.5%(+20.5)#3886.9%(+13.1)#2,594
39.80514100.0%79.5%(+20.5)#3986.9%(+13.1)#2,635
40.80530100.0%79.5%(+20.5)#4086.9%(+13.1)#2,671
41.81137100.0%79.5%(+20.5)#4186.9%(+13.1)#2,693
42.81524100.0%79.5%(+20.5)#4286.9%(+13.1)#3,025
43.80117100.0%79.5%(+20.5)#4386.9%(+13.1)#3,069

Common Questions

What are the Top 10 Zip Codes with the Lowest Percentage of Births to Unmarried Women under the Age of under 20 in Colorado?
Top 10 Zip Codes with the Lowest Percentage of Births to Unmarried Women under the Age of under 20 in Colorado are:
#1
0.0%
#2
0.0%
#3
0.0%
#4
0.0%
#5
0.0%
#6
0.0%
#7
0.0%
#8
0.0%
#9
0.0%
#10
0.0%
What zip code has the Lowest Percentage of Births to Unmarried Women under the Age of under 20 in Colorado?
80229 has the Lowest Percentage of Births to Unmarried Women under the Age of under 20 in Colorado with 16.4%.
What is the Percentage of Births to Unmarried Women under the Age of under 20 in the State of Colorado?
Percentage of Births to Unmarried Women under the Age of under 20 in Colorado is 79.5%.
What is the Percentage of Births to Unmarried Women under the Age of under 20 in the United States?
Percentage of Births to Unmarried Women under the Age of under 20 in the United States is 86.9%.