Zip Codes with the Highest Percentage of Population Employed in Construction & Extraction in Colorado
RELATED REPORTS & OPTIONS
Construction & Extraction
Colorado
Compare Zip Codes
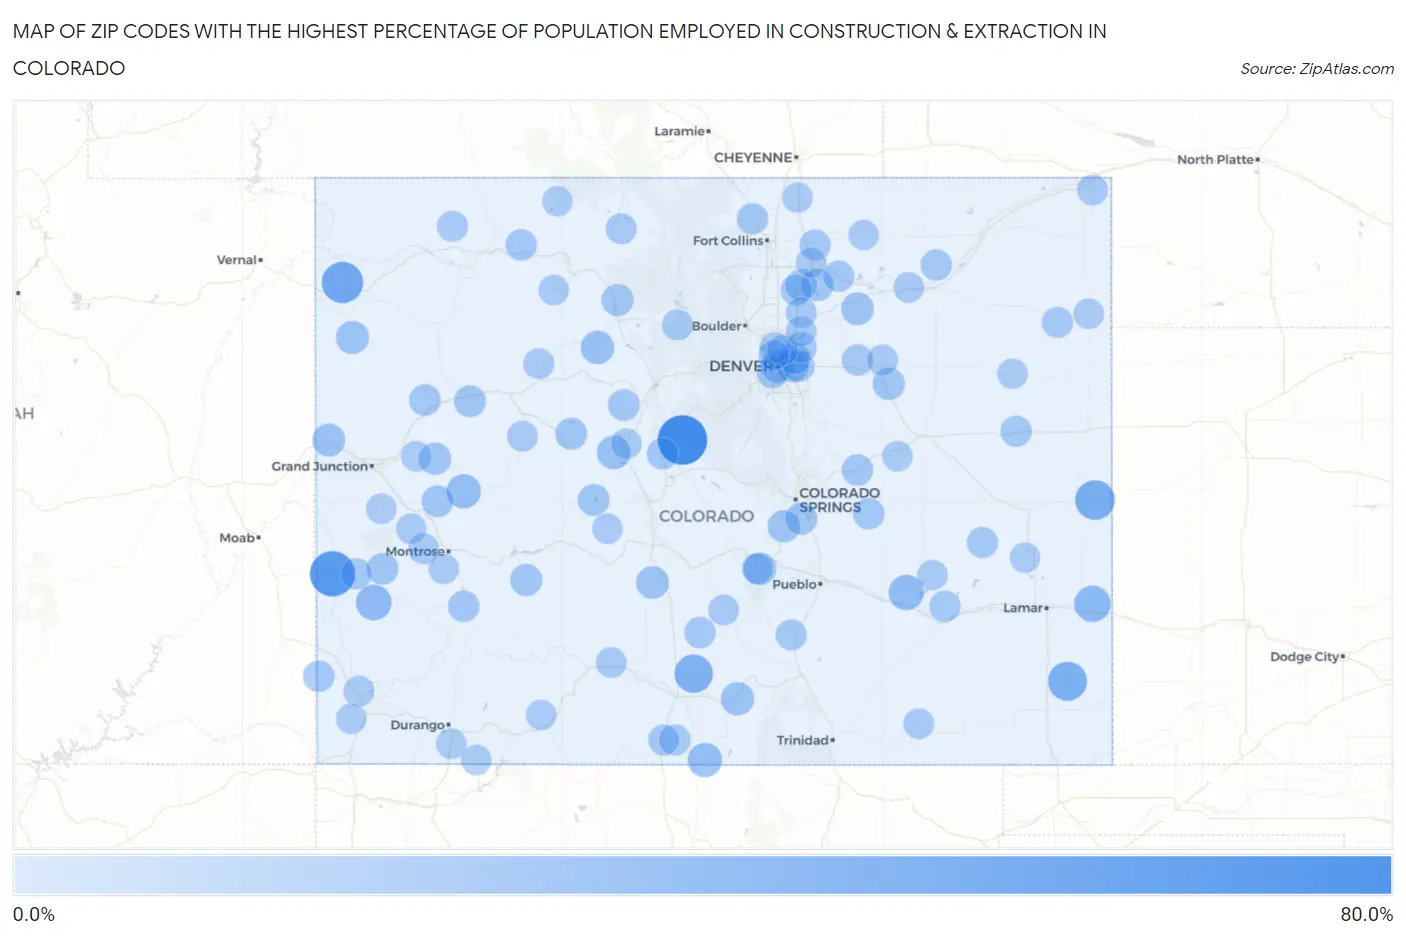
Map of Zip Codes with the Highest Percentage of Population Employed in Construction & Extraction in Colorado
0.0%
80.0%
Zip Codes with the Highest Percentage of Population Employed in Construction & Extraction in Colorado
| Zip Code | % Employed | vs State | vs National | |
| 1. | 80432 | 79.1% | 5.5%(+73.6)#1 | 5.0%(+74.1)#46 |
| 2. | 81429 | 63.4% | 5.5%(+58.0)#2 | 5.0%(+58.4)#70 |
| 3. | 81610 | 49.4% | 5.5%(+43.9)#3 | 5.0%(+44.4)#135 |
| 4. | 80802 | 42.9% | 5.5%(+37.4)#4 | 5.0%(+37.9)#181 |
| 5. | 81084 | 40.9% | 5.5%(+35.5)#5 | 5.0%(+35.9)#201 |
| 6. | 81146 | 38.6% | 5.5%(+33.1)#6 | 5.0%(+33.6)#235 |
| 7. | 81043 | 31.2% | 5.5%(+25.8)#7 | 5.0%(+26.3)#367 |
| 8. | 81431 | 28.9% | 5.5%(+23.4)#8 | 5.0%(+23.9)#430 |
| 9. | 81033 | 27.4% | 5.5%(+21.9)#9 | 5.0%(+22.4)#492 |
| 10. | 81419 | 23.9% | 5.5%(+18.5)#10 | 5.0%(+18.9)#656 |
| 11. | 81138 | 23.8% | 5.5%(+18.4)#11 | 5.0%(+18.8)#665 |
| 12. | 81251 | 21.5% | 5.5%(+16.1)#12 | 5.0%(+16.5)#836 |
| 13. | 80423 | 21.2% | 5.5%(+15.7)#13 | 5.0%(+16.2)#875 |
| 14. | 81133 | 20.5% | 5.5%(+15.0)#14 | 5.0%(+15.5)#936 |
| 15. | 81648 | 19.7% | 5.5%(+14.2)#15 | 5.0%(+14.7)#1,041 |
| 16. | 81525 | 19.5% | 5.5%(+14.0)#16 | 5.0%(+14.5)#1,068 |
| 17. | 81155 | 18.9% | 5.5%(+13.4)#17 | 5.0%(+13.9)#1,159 |
| 18. | 81221 | 18.6% | 5.5%(+13.2)#18 | 5.0%(+13.7)#1,185 |
| 19. | 80290 | 18.3% | 5.5%(+12.9)#19 | 5.0%(+13.3)#1,241 |
| 20. | 80652 | 18.1% | 5.5%(+12.7)#20 | 5.0%(+13.1)#1,278 |
| 21. | 80105 | 17.3% | 5.5%(+11.8)#21 | 5.0%(+12.3)#1,421 |
| 22. | 80645 | 17.1% | 5.5%(+11.7)#22 | 5.0%(+12.1)#1,442 |
| 23. | 81646 | 16.9% | 5.5%(+11.5)#23 | 5.0%(+12.0)#1,480 |
| 24. | 80926 | 16.7% | 5.5%(+11.3)#24 | 5.0%(+11.7)#1,521 |
| 25. | 80459 | 16.4% | 5.5%(+11.0)#25 | 5.0%(+11.4)#1,608 |
| 26. | 81243 | 16.4% | 5.5%(+10.9)#26 | 5.0%(+11.4)#1,618 |
| 27. | 80913 | 15.9% | 5.5%(+10.5)#27 | 5.0%(+10.9)#1,745 |
| 28. | 81210 | 15.7% | 5.5%(+10.2)#28 | 5.0%(+10.7)#1,808 |
| 29. | 80010 | 15.5% | 5.5%(+10.1)#29 | 5.0%(+10.5)#1,843 |
| 30. | 81656 | 15.5% | 5.5%(+10.1)#30 | 5.0%(+10.5)#1,847 |
| 31. | 80219 | 15.4% | 5.5%(+9.96)#31 | 5.0%(+10.4)#1,871 |
| 32. | 81410 | 15.4% | 5.5%(+9.95)#32 | 5.0%(+10.4)#1,874 |
| 33. | 81652 | 15.3% | 5.5%(+9.84)#33 | 5.0%(+10.3)#1,908 |
| 34. | 81424 | 15.3% | 5.5%(+9.84)#34 | 5.0%(+10.3)#1,910 |
| 35. | 81635 | 14.9% | 5.5%(+9.44)#35 | 5.0%(+9.89)#2,071 |
| 36. | 81649 | 14.8% | 5.5%(+9.38)#36 | 5.0%(+9.84)#2,091 |
| 37. | 80808 | 14.8% | 5.5%(+9.36)#37 | 5.0%(+9.81)#2,101 |
| 38. | 81639 | 14.6% | 5.5%(+9.10)#38 | 5.0%(+9.56)#2,216 |
| 39. | 80623 | 14.3% | 5.5%(+8.81)#39 | 5.0%(+9.27)#2,342 |
| 40. | 80011 | 14.2% | 5.5%(+8.79)#40 | 5.0%(+9.25)#2,349 |
| 41. | 80864 | 14.2% | 5.5%(+8.76)#41 | 5.0%(+9.21)#2,360 |
| 42. | 81324 | 14.2% | 5.5%(+8.72)#42 | 5.0%(+9.18)#2,377 |
| 43. | 80440 | 14.1% | 5.5%(+8.63)#43 | 5.0%(+9.09)#2,421 |
| 44. | 81432 | 14.0% | 5.5%(+8.53)#44 | 5.0%(+8.98)#2,468 |
| 45. | 80535 | 14.0% | 5.5%(+8.51)#45 | 5.0%(+8.97)#2,474 |
| 46. | 80136 | 13.8% | 5.5%(+8.30)#46 | 5.0%(+8.76)#2,567 |
| 47. | 81131 | 13.7% | 5.5%(+8.25)#47 | 5.0%(+8.70)#2,603 |
| 48. | 80644 | 13.6% | 5.5%(+8.19)#48 | 5.0%(+8.65)#2,630 |
| 49. | 80750 | 13.6% | 5.5%(+8.19)#49 | 5.0%(+8.64)#2,632 |
| 50. | 80834 | 13.5% | 5.5%(+8.06)#50 | 5.0%(+8.52)#2,697 |
| 51. | 80651 | 13.5% | 5.5%(+8.06)#51 | 5.0%(+8.52)#2,702 |
| 52. | 81030 | 13.3% | 5.5%(+7.88)#52 | 5.0%(+8.34)#2,784 |
| 53. | 81141 | 13.3% | 5.5%(+7.80)#53 | 5.0%(+8.26)#2,813 |
| 54. | 80239 | 13.2% | 5.5%(+7.73)#54 | 5.0%(+8.18)#2,849 |
| 55. | 81045 | 13.2% | 5.5%(+7.71)#55 | 5.0%(+8.16)#2,856 |
| 56. | 81422 | 13.0% | 5.5%(+7.57)#56 | 5.0%(+8.03)#2,924 |
| 57. | 81069 | 12.9% | 5.5%(+7.41)#57 | 5.0%(+7.87)#3,013 |
| 58. | 80615 | 12.8% | 5.5%(+7.31)#58 | 5.0%(+7.77)#3,072 |
| 59. | 80727 | 12.7% | 5.5%(+7.25)#59 | 5.0%(+7.70)#3,117 |
| 60. | 81148 | 12.7% | 5.5%(+7.20)#60 | 5.0%(+7.66)#3,156 |
| 61. | 81244 | 12.5% | 5.5%(+7.05)#61 | 5.0%(+7.51)#3,253 |
| 62. | 80480 | 12.4% | 5.5%(+6.98)#62 | 5.0%(+7.44)#3,322 |
| 63. | 81625 | 12.3% | 5.5%(+6.88)#63 | 5.0%(+7.34)#3,378 |
| 64. | 80478 | 12.3% | 5.5%(+6.81)#64 | 5.0%(+7.27)#3,418 |
| 65. | 81637 | 12.2% | 5.5%(+6.76)#65 | 5.0%(+7.22)#3,445 |
| 66. | 80022 | 12.1% | 5.5%(+6.60)#66 | 5.0%(+7.06)#3,555 |
| 67. | 80260 | 12.0% | 5.5%(+6.58)#67 | 5.0%(+7.04)#3,566 |
| 68. | 80103 | 12.0% | 5.5%(+6.55)#68 | 5.0%(+7.01)#3,582 |
| 69. | 81623 | 12.0% | 5.5%(+6.53)#69 | 5.0%(+6.99)#3,600 |
| 70. | 81425 | 11.9% | 5.5%(+6.42)#70 | 5.0%(+6.87)#3,671 |
| 71. | 80705 | 11.7% | 5.5%(+6.21)#71 | 5.0%(+6.67)#3,847 |
| 72. | 80737 | 11.6% | 5.5%(+6.14)#72 | 5.0%(+6.60)#3,888 |
| 73. | 80621 | 11.6% | 5.5%(+6.12)#73 | 5.0%(+6.58)#3,903 |
| 74. | 81252 | 11.5% | 5.5%(+6.06)#74 | 5.0%(+6.51)#3,951 |
| 75. | 81132 | 11.4% | 5.5%(+5.95)#75 | 5.0%(+6.41)#4,031 |
| 76. | 80229 | 11.3% | 5.5%(+5.90)#76 | 5.0%(+6.35)#4,068 |
| 77. | 81027 | 11.3% | 5.5%(+5.87)#77 | 5.0%(+6.33)#4,095 |
| 78. | 80467 | 11.2% | 5.5%(+5.78)#78 | 5.0%(+6.24)#4,169 |
| 79. | 81327 | 11.1% | 5.5%(+5.66)#79 | 5.0%(+6.12)#4,277 |
| 80. | 81416 | 11.1% | 5.5%(+5.65)#80 | 5.0%(+6.11)#4,296 |
| 81. | 80758 | 11.1% | 5.5%(+5.62)#81 | 5.0%(+6.08)#4,310 |
| 82. | 81403 | 11.1% | 5.5%(+5.61)#82 | 5.0%(+6.07)#4,317 |
| 83. | 81527 | 11.0% | 5.5%(+5.60)#83 | 5.0%(+6.05)#4,327 |
| 84. | 81643 | 11.0% | 5.5%(+5.58)#84 | 5.0%(+6.04)#4,337 |
| 85. | 81241 | 11.0% | 5.5%(+5.54)#85 | 5.0%(+5.99)#4,376 |
| 86. | 80812 | 11.0% | 5.5%(+5.51)#86 | 5.0%(+5.96)#4,404 |
| 87. | 81076 | 11.0% | 5.5%(+5.50)#87 | 5.0%(+5.96)#4,412 |
| 88. | 80631 | 10.9% | 5.5%(+5.48)#88 | 5.0%(+5.93)#4,437 |
| 89. | 80830 | 10.9% | 5.5%(+5.42)#89 | 5.0%(+5.88)#4,502 |
| 90. | 80461 | 10.9% | 5.5%(+5.41)#90 | 5.0%(+5.86)#4,512 |
| 91. | 81321 | 10.8% | 5.5%(+5.34)#91 | 5.0%(+5.80)#4,565 |
| 92. | 80603 | 10.8% | 5.5%(+5.31)#92 | 5.0%(+5.76)#4,596 |
| 93. | 81147 | 10.8% | 5.5%(+5.31)#93 | 5.0%(+5.76)#4,597 |
| 94. | 81303 | 10.7% | 5.5%(+5.27)#94 | 5.0%(+5.73)#4,628 |
| 95. | 81137 | 10.7% | 5.5%(+5.24)#95 | 5.0%(+5.70)#4,659 |
| 96. | 80221 | 10.6% | 5.5%(+5.12)#96 | 5.0%(+5.58)#4,784 |
| 97. | 80611 | 10.5% | 5.5%(+5.06)#97 | 5.0%(+5.52)#4,845 |
| 98. | 80428 | 10.5% | 5.5%(+5.05)#98 | 5.0%(+5.51)#4,851 |
| 99. | 80612 | 10.5% | 5.5%(+5.02)#99 | 5.0%(+5.48)#4,882 |
| 100. | 81036 | 10.4% | 5.5%(+4.94)#100 | 5.0%(+5.40)#4,977 |
Common Questions
What are the Top 10 Zip Codes with the Highest Percentage of Population Employed in Construction & Extraction in Colorado?
Top 10 Zip Codes with the Highest Percentage of Population Employed in Construction & Extraction in Colorado are:
What zip code has the Highest Percentage of Population Employed in Construction & Extraction in Colorado?
80432 has the Highest Percentage of Population Employed in Construction & Extraction in Colorado with 79.1%.
What is the Percentage of Population Employed in Construction & Extraction in the State of Colorado?
Percentage of Population Employed in Construction & Extraction in Colorado is 5.5%.
What is the Percentage of Population Employed in Construction & Extraction in the United States?
Percentage of Population Employed in Construction & Extraction in the United States is 5.0%.