Zip Codes with the Highest Percentage of Population with a Degree in Literature and Languages in Colorado
RELATED REPORTS & OPTIONS
Literature and Languages
Colorado
Compare Zip Codes
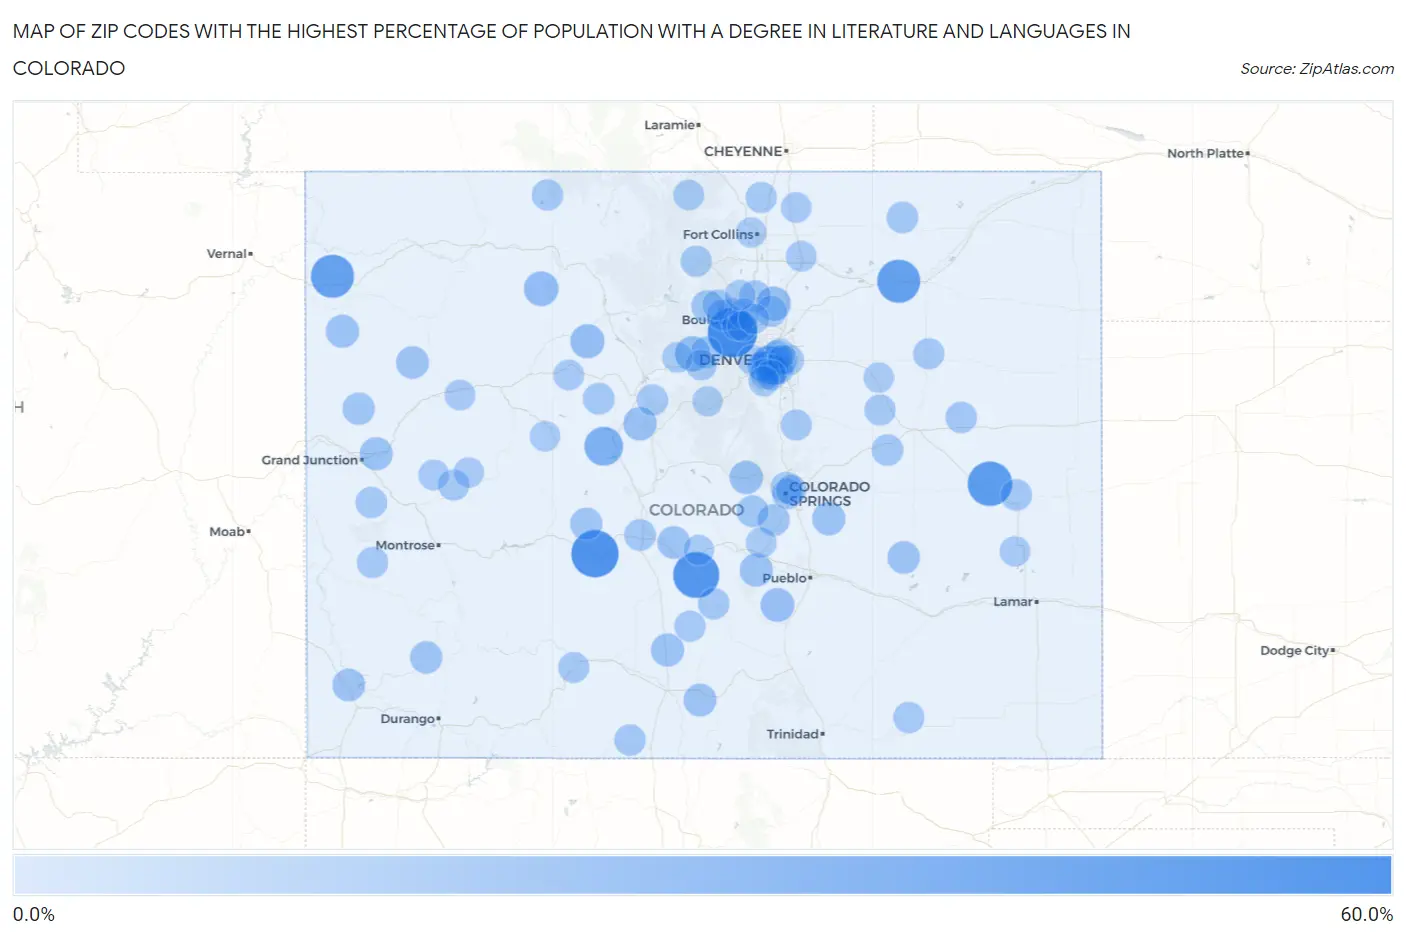
Map of Zip Codes with the Highest Percentage of Population with a Degree in Literature and Languages in Colorado
0.0%
60.0%
Zip Codes with the Highest Percentage of Population with a Degree in Literature and Languages in Colorado
| Zip Code | % Graduates | vs State | vs National | |
| 1. | 80025 | 56.0% | 4.6%(+51.4)#1 | 4.4%(+51.6)#46 |
| 2. | 81248 | 50.0% | 4.6%(+45.4)#2 | 4.4%(+45.6)#66 |
| 3. | 81232 | 46.9% | 4.6%(+42.3)#3 | 4.4%(+42.5)#87 |
| 4. | 80862 | 42.9% | 4.6%(+38.2)#4 | 4.4%(+38.4)#105 |
| 5. | 80705 | 38.9% | 4.6%(+34.3)#5 | 4.4%(+34.5)#125 |
| 6. | 81610 | 38.9% | 4.6%(+34.3)#6 | 4.4%(+34.5)#126 |
| 7. | 81251 | 27.3% | 4.6%(+22.6)#7 | 4.4%(+22.9)#249 |
| 8. | 80436 | 17.8% | 4.6%(+13.2)#8 | 4.4%(+13.4)#584 |
| 9. | 80469 | 16.9% | 4.6%(+12.2)#9 | 4.4%(+12.5)#644 |
| 10. | 80520 | 16.0% | 4.6%(+11.4)#10 | 4.4%(+11.6)#721 |
| 11. | 80423 | 15.5% | 4.6%(+10.9)#11 | 4.4%(+11.1)#774 |
| 12. | 81023 | 14.8% | 4.6%(+10.2)#12 | 4.4%(+10.4)#831 |
| 13. | 80420 | 14.0% | 4.6%(+9.35)#13 | 4.4%(+9.57)#927 |
| 14. | 80814 | 13.4% | 4.6%(+8.83)#14 | 4.4%(+9.04)#985 |
| 15. | 80928 | 13.2% | 4.6%(+8.62)#15 | 4.4%(+8.84)#1,019 |
| 16. | 81136 | 13.0% | 4.6%(+8.34)#16 | 4.4%(+8.55)#1,057 |
| 17. | 81648 | 12.9% | 4.6%(+8.33)#17 | 4.4%(+8.54)#1,060 |
| 18. | 81226 | 12.8% | 4.6%(+8.17)#18 | 4.4%(+8.38)#1,082 |
| 19. | 81520 | 12.6% | 4.6%(+8.01)#19 | 4.4%(+8.23)#1,116 |
| 20. | 81123 | 12.1% | 4.6%(+7.50)#20 | 4.4%(+7.71)#1,200 |
| 21. | 81650 | 12.0% | 4.6%(+7.41)#21 | 4.4%(+7.63)#1,217 |
| 22. | 81233 | 11.8% | 4.6%(+7.20)#22 | 4.4%(+7.42)#1,251 |
| 23. | 81327 | 11.7% | 4.6%(+7.03)#23 | 4.4%(+7.24)#1,301 |
| 24. | 81063 | 11.5% | 4.6%(+6.90)#24 | 4.4%(+7.11)#1,328 |
| 25. | 81332 | 11.1% | 4.6%(+6.44)#25 | 4.4%(+6.65)#1,457 |
| 26. | 81630 | 11.0% | 4.6%(+6.35)#26 | 4.4%(+6.57)#1,484 |
| 27. | 80481 | 10.7% | 4.6%(+6.07)#27 | 4.4%(+6.28)#1,558 |
| 28. | 81237 | 10.6% | 4.6%(+5.95)#28 | 4.4%(+6.16)#1,604 |
| 29. | 80926 | 10.1% | 4.6%(+5.45)#29 | 4.4%(+5.66)#1,788 |
| 30. | 80860 | 9.8% | 4.6%(+5.16)#30 | 4.4%(+5.37)#1,921 |
| 31. | 80223 | 9.7% | 4.6%(+5.09)#31 | 4.4%(+5.30)#1,952 |
| 32. | 80218 | 9.5% | 4.6%(+4.89)#32 | 4.4%(+5.11)#2,039 |
| 33. | 80501 | 9.5% | 4.6%(+4.86)#33 | 4.4%(+5.08)#2,050 |
| 34. | 80206 | 9.4% | 4.6%(+4.79)#34 | 4.4%(+5.00)#2,081 |
| 35. | 81201 | 9.4% | 4.6%(+4.73)#35 | 4.4%(+4.94)#2,116 |
| 36. | 80427 | 9.2% | 4.6%(+4.53)#36 | 4.4%(+4.75)#2,236 |
| 37. | 81645 | 9.1% | 4.6%(+4.52)#37 | 4.4%(+4.74)#2,239 |
| 38. | 80825 | 9.1% | 4.6%(+4.47)#38 | 4.4%(+4.68)#2,276 |
| 39. | 80742 | 9.1% | 4.6%(+4.47)#39 | 4.4%(+4.68)#2,278 |
| 40. | 80830 | 8.9% | 4.6%(+4.27)#40 | 4.4%(+4.48)#2,382 |
| 41. | 80304 | 8.7% | 4.6%(+4.08)#41 | 4.4%(+4.29)#2,473 |
| 42. | 80804 | 8.7% | 4.6%(+4.07)#42 | 4.4%(+4.29)#2,489 |
| 43. | 80302 | 8.5% | 4.6%(+3.88)#43 | 4.4%(+4.10)#2,612 |
| 44. | 81252 | 8.5% | 4.6%(+3.85)#44 | 4.4%(+4.06)#2,633 |
| 45. | 81120 | 8.5% | 4.6%(+3.83)#45 | 4.4%(+4.05)#2,642 |
| 46. | 81527 | 8.4% | 4.6%(+3.74)#46 | 4.4%(+3.95)#2,702 |
| 47. | 80514 | 8.4% | 4.6%(+3.74)#47 | 4.4%(+3.95)#2,704 |
| 48. | 80428 | 8.2% | 4.6%(+3.62)#48 | 4.4%(+3.84)#2,783 |
| 49. | 80424 | 8.2% | 4.6%(+3.62)#49 | 4.4%(+3.84)#2,785 |
| 50. | 80907 | 8.1% | 4.6%(+3.51)#50 | 4.4%(+3.72)#2,875 |
| 51. | 81027 | 8.1% | 4.6%(+3.48)#51 | 4.4%(+3.70)#2,898 |
| 52. | 80517 | 8.1% | 4.6%(+3.48)#52 | 4.4%(+3.69)#2,901 |
| 53. | 81424 | 8.1% | 4.6%(+3.45)#53 | 4.4%(+3.66)#2,926 |
| 54. | 80101 | 8.0% | 4.6%(+3.38)#54 | 4.4%(+3.59)#2,984 |
| 55. | 80757 | 7.9% | 4.6%(+3.31)#55 | 4.4%(+3.53)#3,037 |
| 56. | 81419 | 7.9% | 4.6%(+3.25)#56 | 4.4%(+3.46)#3,089 |
| 57. | 81131 | 7.8% | 4.6%(+3.22)#57 | 4.4%(+3.43)#3,114 |
| 58. | 80116 | 7.7% | 4.6%(+3.12)#58 | 4.4%(+3.33)#3,206 |
| 59. | 80549 | 7.7% | 4.6%(+3.12)#59 | 4.4%(+3.33)#3,211 |
| 60. | 80207 | 7.6% | 4.6%(+3.00)#60 | 4.4%(+3.21)#3,336 |
| 61. | 81154 | 7.4% | 4.6%(+2.81)#61 | 4.4%(+3.02)#3,515 |
| 62. | 80903 | 7.4% | 4.6%(+2.79)#62 | 4.4%(+3.00)#3,534 |
| 63. | 80220 | 7.4% | 4.6%(+2.78)#63 | 4.4%(+2.99)#3,554 |
| 64. | 80224 | 7.3% | 4.6%(+2.71)#64 | 4.4%(+2.92)#3,624 |
| 65. | 80305 | 7.2% | 4.6%(+2.59)#65 | 4.4%(+2.81)#3,738 |
| 66. | 80203 | 7.0% | 4.6%(+2.39)#66 | 4.4%(+2.60)#3,983 |
| 67. | 80452 | 7.0% | 4.6%(+2.38)#67 | 4.4%(+2.60)#3,991 |
| 68. | 80209 | 7.0% | 4.6%(+2.34)#68 | 4.4%(+2.55)#4,037 |
| 69. | 81631 | 7.0% | 4.6%(+2.33)#69 | 4.4%(+2.54)#4,054 |
| 70. | 80210 | 6.9% | 4.6%(+2.31)#70 | 4.4%(+2.52)#4,073 |
| 71. | 80631 | 6.9% | 4.6%(+2.30)#71 | 4.4%(+2.51)#4,084 |
| 72. | 80301 | 6.9% | 4.6%(+2.28)#72 | 4.4%(+2.49)#4,103 |
| 73. | 81652 | 6.9% | 4.6%(+2.26)#73 | 4.4%(+2.48)#4,123 |
| 74. | 80231 | 6.8% | 4.6%(+2.19)#74 | 4.4%(+2.41)#4,220 |
| 75. | 81413 | 6.8% | 4.6%(+2.17)#75 | 4.4%(+2.38)#4,246 |
| 76. | 80648 | 6.7% | 4.6%(+2.10)#76 | 4.4%(+2.32)#4,332 |
| 77. | 80455 | 6.6% | 4.6%(+1.99)#77 | 4.4%(+2.21)#4,477 |
| 78. | 80545 | 6.6% | 4.6%(+1.98)#78 | 4.4%(+2.19)#4,495 |
| 79. | 80303 | 6.6% | 4.6%(+1.94)#79 | 4.4%(+2.15)#4,551 |
| 80. | 81036 | 6.6% | 4.6%(+1.93)#80 | 4.4%(+2.15)#4,567 |
| 81. | 80011 | 6.5% | 4.6%(+1.92)#81 | 4.4%(+2.13)#4,587 |
| 82. | 81240 | 6.5% | 4.6%(+1.90)#82 | 4.4%(+2.11)#4,606 |
| 83. | 80438 | 6.5% | 4.6%(+1.87)#83 | 4.4%(+2.08)#4,648 |
| 84. | 80909 | 6.5% | 4.6%(+1.84)#84 | 4.4%(+2.05)#4,701 |
| 85. | 80026 | 6.4% | 4.6%(+1.81)#85 | 4.4%(+2.03)#4,737 |
| 86. | 80219 | 6.4% | 4.6%(+1.78)#86 | 4.4%(+1.99)#4,796 |
| 87. | 80222 | 6.4% | 4.6%(+1.77)#87 | 4.4%(+1.98)#4,816 |
| 88. | 81615 | 6.3% | 4.6%(+1.66)#88 | 4.4%(+1.87)#4,960 |
| 89. | 80238 | 6.2% | 4.6%(+1.62)#89 | 4.4%(+1.84)#5,030 |
| 90. | 81428 | 6.2% | 4.6%(+1.56)#90 | 4.4%(+1.78)#5,112 |
| 91. | 80215 | 6.1% | 4.6%(+1.52)#91 | 4.4%(+1.74)#5,183 |
| 92. | 80105 | 6.1% | 4.6%(+1.48)#92 | 4.4%(+1.70)#5,262 |
| 93. | 80010 | 6.1% | 4.6%(+1.47)#93 | 4.4%(+1.68)#5,283 |
| 94. | 81223 | 6.0% | 4.6%(+1.38)#94 | 4.4%(+1.59)#5,408 |
| 95. | 80110 | 6.0% | 4.6%(+1.34)#95 | 4.4%(+1.55)#5,478 |
| 96. | 80521 | 5.9% | 4.6%(+1.31)#96 | 4.4%(+1.53)#5,526 |
| 97. | 80503 | 5.9% | 4.6%(+1.30)#97 | 4.4%(+1.51)#5,566 |
| 98. | 80113 | 5.9% | 4.6%(+1.30)#98 | 4.4%(+1.51)#5,567 |
| 99. | 80120 | 5.9% | 4.6%(+1.26)#99 | 4.4%(+1.47)#5,640 |
| 100. | 80421 | 5.9% | 4.6%(+1.25)#100 | 4.4%(+1.47)#5,643 |
Common Questions
What are the Top 10 Zip Codes with the Highest Percentage of Population with a Degree in Literature and Languages in Colorado?
Top 10 Zip Codes with the Highest Percentage of Population with a Degree in Literature and Languages in Colorado are:
What zip code has the Highest Percentage of Population with a Degree in Literature and Languages in Colorado?
80025 has the Highest Percentage of Population with a Degree in Literature and Languages in Colorado with 56.0%.
What is the Percentage of Population with a Degree in Literature and Languages in the State of Colorado?
Percentage of Population with a Degree in Literature and Languages in Colorado is 4.6%.
What is the Percentage of Population with a Degree in Literature and Languages in the United States?
Percentage of Population with a Degree in Literature and Languages in the United States is 4.4%.