Puget Sound Salish vs U.S. Virgin Islander 2 or more Vehicles in Household
COMPARE
Puget Sound Salish
U.S. Virgin Islander
2 or more Vehicles in Household
2 or more Vehicles in Household Comparison
Puget Sound Salish
U.S. Virgin Islanders
62.1%
2 OR MORE VEHICLES IN HOUSEHOLD
100.0/ 100
METRIC RATING
7th/ 347
METRIC RANK
47.5%
2 OR MORE VEHICLES IN HOUSEHOLD
0.0/ 100
METRIC RATING
313th/ 347
METRIC RANK
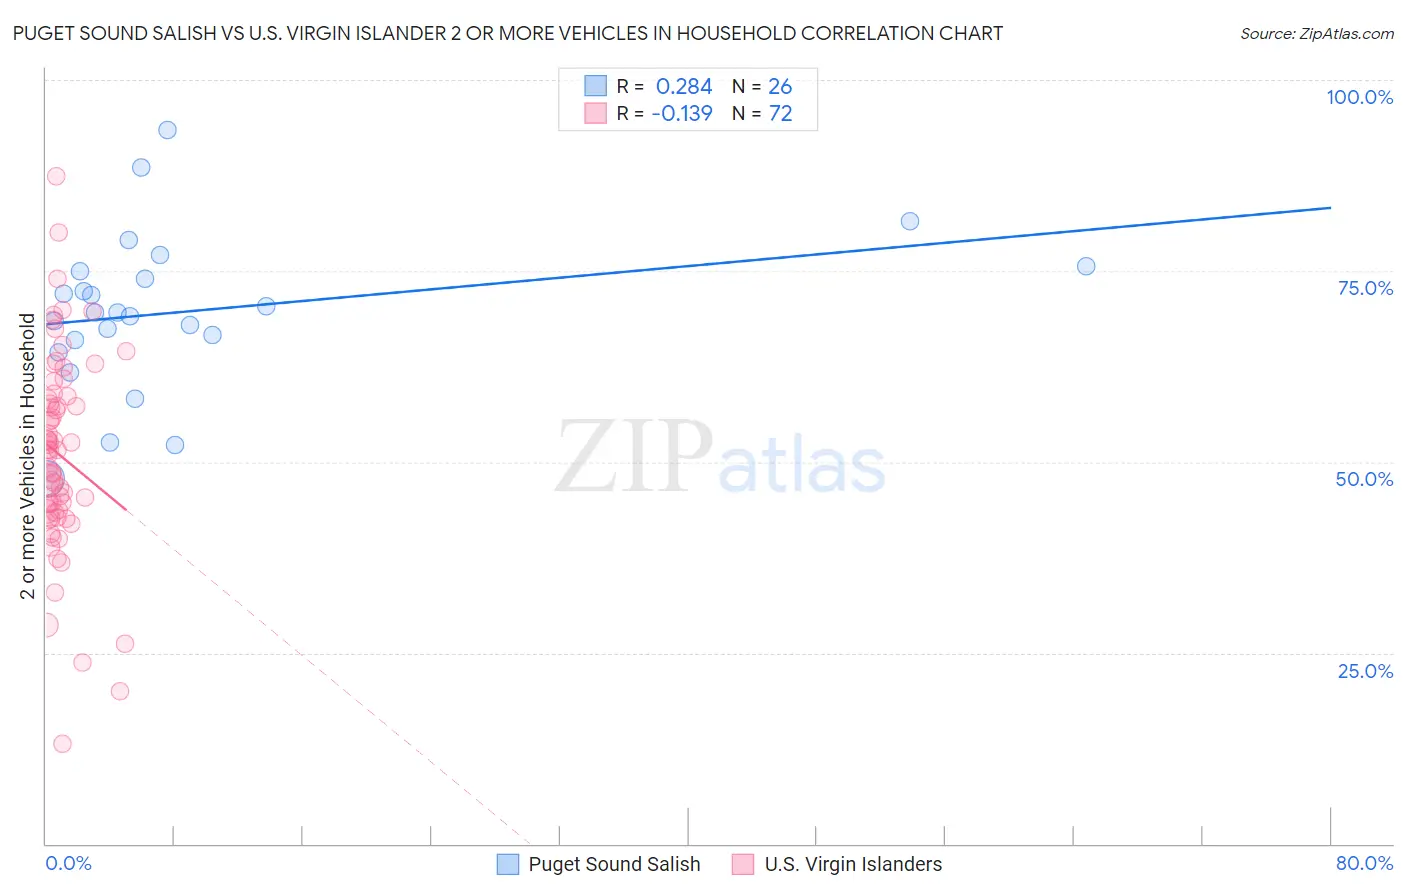
Puget Sound Salish vs U.S. Virgin Islander 2 or more Vehicles in Household Correlation Chart
The statistical analysis conducted on geographies consisting of 46,155,865 people shows a weak positive correlation between the proportion of Puget Sound Salish and percentage of households with 2 or more vehicles available in the United States with a correlation coefficient (R) of 0.284 and weighted average of 62.1%. Similarly, the statistical analysis conducted on geographies consisting of 87,429,921 people shows a poor negative correlation between the proportion of U.S. Virgin Islanders and percentage of households with 2 or more vehicles available in the United States with a correlation coefficient (R) of -0.139 and weighted average of 47.5%, a difference of 30.7%.
2 or more Vehicles in Household Correlation Summary
| Measurement | Puget Sound Salish | U.S. Virgin Islander |
| Minimum | 47.8% | 13.1% |
| Maximum | 93.4% | 87.3% |
| Range | 45.6% | 74.2% |
| Mean | 69.7% | 50.9% |
| Median | 69.6% | 51.5% |
| Interquartile 25% (IQ1) | 66.0% | 43.4% |
| Interquartile 75% (IQ3) | 75.0% | 58.4% |
| Interquartile Range (IQR) | 9.0% | 14.9% |
| Standard Deviation (Sample) | 10.3% | 13.1% |
| Standard Deviation (Population) | 10.1% | 13.0% |
Similar Demographics by 2 or more Vehicles in Household
Demographics Similar to Puget Sound Salish by 2 or more Vehicles in Household
In terms of 2 or more vehicles in household, the demographic groups most similar to Puget Sound Salish are Scandinavian (62.1%, a difference of 0.060%), English (61.9%, a difference of 0.27%), Swedish (61.8%, a difference of 0.34%), Immigrants from Fiji (62.3%, a difference of 0.40%), and Mexican (61.7%, a difference of 0.62%).
| Demographics | Rating | Rank | 2 or more Vehicles in Household |
| Yakama | 100.0 /100 | #1 | Exceptional 64.9% |
| Tongans | 100.0 /100 | #2 | Exceptional 63.5% |
| Danes | 100.0 /100 | #3 | Exceptional 63.3% |
| Norwegians | 100.0 /100 | #4 | Exceptional 62.8% |
| Immigrants | Fiji | 100.0 /100 | #5 | Exceptional 62.3% |
| Scandinavians | 100.0 /100 | #6 | Exceptional 62.1% |
| Puget Sound Salish | 100.0 /100 | #7 | Exceptional 62.1% |
| English | 100.0 /100 | #8 | Exceptional 61.9% |
| Swedes | 100.0 /100 | #9 | Exceptional 61.8% |
| Mexicans | 100.0 /100 | #10 | Exceptional 61.7% |
| Dutch | 100.0 /100 | #11 | Exceptional 61.6% |
| Germans | 100.0 /100 | #12 | Exceptional 61.6% |
| Samoans | 100.0 /100 | #13 | Exceptional 61.5% |
| Czechs | 100.0 /100 | #14 | Exceptional 61.5% |
| Nepalese | 100.0 /100 | #15 | Exceptional 61.4% |
Demographics Similar to U.S. Virgin Islanders by 2 or more Vehicles in Household
In terms of 2 or more vehicles in household, the demographic groups most similar to U.S. Virgin Islanders are Haitian (47.6%, a difference of 0.17%), Immigrants from Ghana (47.4%, a difference of 0.22%), Puerto Rican (47.1%, a difference of 0.80%), Immigrants from Belarus (47.9%, a difference of 0.91%), and Ghanaian (48.0%, a difference of 1.0%).
| Demographics | Rating | Rank | 2 or more Vehicles in Household |
| Immigrants | Israel | 0.0 /100 | #306 | Tragic 49.2% |
| Hopi | 0.0 /100 | #307 | Tragic 49.0% |
| Albanians | 0.0 /100 | #308 | Tragic 49.0% |
| Moroccans | 0.0 /100 | #309 | Tragic 48.8% |
| Ghanaians | 0.0 /100 | #310 | Tragic 48.0% |
| Immigrants | Belarus | 0.0 /100 | #311 | Tragic 47.9% |
| Haitians | 0.0 /100 | #312 | Tragic 47.6% |
| U.S. Virgin Islanders | 0.0 /100 | #313 | Tragic 47.5% |
| Immigrants | Ghana | 0.0 /100 | #314 | Tragic 47.4% |
| Puerto Ricans | 0.0 /100 | #315 | Tragic 47.1% |
| Cape Verdeans | 0.0 /100 | #316 | Tragic 46.8% |
| Immigrants | Haiti | 0.0 /100 | #317 | Tragic 46.5% |
| Immigrants | Albania | 0.0 /100 | #318 | Tragic 46.0% |
| Jamaicans | 0.0 /100 | #319 | Tragic 45.8% |
| Soviet Union | 0.0 /100 | #320 | Tragic 45.7% |