Kenyan vs Carpatho Rusyn 2 or more Vehicles in Household
COMPARE
Kenyan
Carpatho Rusyn
2 or more Vehicles in Household
2 or more Vehicles in Household Comparison
Kenyans
Carpatho Rusyns
55.5%
2 OR MORE VEHICLES IN HOUSEHOLD
58.1/ 100
METRIC RATING
167th/ 347
METRIC RANK
54.4%
2 OR MORE VEHICLES IN HOUSEHOLD
16.2/ 100
METRIC RATING
198th/ 347
METRIC RANK
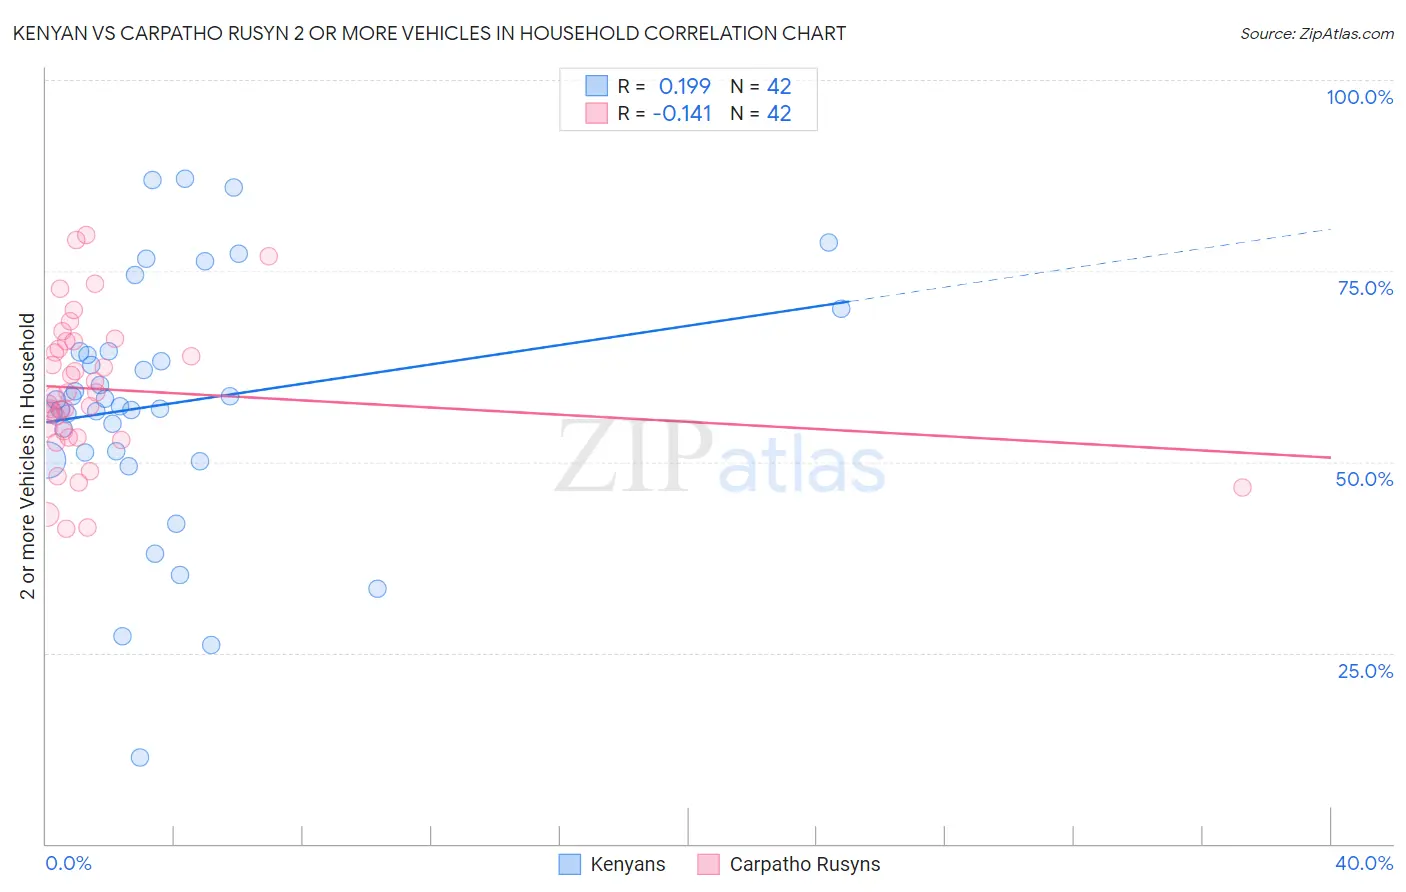
Kenyan vs Carpatho Rusyn 2 or more Vehicles in Household Correlation Chart
The statistical analysis conducted on geographies consisting of 168,179,955 people shows a poor positive correlation between the proportion of Kenyans and percentage of households with 2 or more vehicles available in the United States with a correlation coefficient (R) of 0.199 and weighted average of 55.5%. Similarly, the statistical analysis conducted on geographies consisting of 58,871,690 people shows a poor negative correlation between the proportion of Carpatho Rusyns and percentage of households with 2 or more vehicles available in the United States with a correlation coefficient (R) of -0.141 and weighted average of 54.4%, a difference of 2.0%.
2 or more Vehicles in Household Correlation Summary
| Measurement | Kenyan | Carpatho Rusyn |
| Minimum | 11.3% | 41.3% |
| Maximum | 87.1% | 79.7% |
| Range | 75.8% | 38.5% |
| Mean | 57.6% | 59.5% |
| Median | 57.7% | 58.9% |
| Interquartile 25% (IQ1) | 51.2% | 53.2% |
| Interquartile 75% (IQ3) | 64.4% | 65.8% |
| Interquartile Range (IQR) | 13.2% | 12.6% |
| Standard Deviation (Sample) | 16.2% | 9.5% |
| Standard Deviation (Population) | 16.0% | 9.4% |
Similar Demographics by 2 or more Vehicles in Household
Demographics Similar to Kenyans by 2 or more Vehicles in Household
In terms of 2 or more vehicles in household, the demographic groups most similar to Kenyans are Immigrants from Sri Lanka (55.5%, a difference of 0.010%), Immigrants from El Salvador (55.6%, a difference of 0.050%), French American Indian (55.5%, a difference of 0.060%), Dutch West Indian (55.6%, a difference of 0.070%), and Immigrants from Austria (55.5%, a difference of 0.070%).
| Demographics | Rating | Rank | 2 or more Vehicles in Household |
| Crow | 67.0 /100 | #160 | Good 55.7% |
| Colville | 61.1 /100 | #161 | Good 55.6% |
| German Russians | 60.9 /100 | #162 | Good 55.6% |
| Immigrants | Zimbabwe | 60.2 /100 | #163 | Good 55.6% |
| Dutch West Indians | 59.8 /100 | #164 | Average 55.6% |
| Immigrants | El Salvador | 59.4 /100 | #165 | Average 55.6% |
| Immigrants | Sri Lanka | 58.3 /100 | #166 | Average 55.5% |
| Kenyans | 58.1 /100 | #167 | Average 55.5% |
| French American Indians | 56.7 /100 | #168 | Average 55.5% |
| Immigrants | Austria | 56.3 /100 | #169 | Average 55.5% |
| Romanians | 55.8 /100 | #170 | Average 55.5% |
| Immigrants | Costa Rica | 54.4 /100 | #171 | Average 55.4% |
| Immigrants | Nicaragua | 51.6 /100 | #172 | Average 55.4% |
| Immigrants | Western Europe | 51.4 /100 | #173 | Average 55.4% |
| Navajo | 50.0 /100 | #174 | Average 55.3% |
Demographics Similar to Carpatho Rusyns by 2 or more Vehicles in Household
In terms of 2 or more vehicles in household, the demographic groups most similar to Carpatho Rusyns are Immigrants from Norway (54.4%, a difference of 0.030%), Houma (54.4%, a difference of 0.030%), Immigrants from Italy (54.4%, a difference of 0.060%), Argentinean (54.5%, a difference of 0.090%), and Immigrants from North Macedonia (54.4%, a difference of 0.11%).
| Demographics | Rating | Rank | 2 or more Vehicles in Household |
| Immigrants | Immigrants | 25.0 /100 | #191 | Fair 54.7% |
| Immigrants | Romania | 23.8 /100 | #192 | Fair 54.7% |
| Immigrants | Japan | 23.4 /100 | #193 | Fair 54.7% |
| Central Americans | 23.0 /100 | #194 | Fair 54.7% |
| Iroquois | 22.6 /100 | #195 | Fair 54.7% |
| Immigrants | Poland | 19.3 /100 | #196 | Poor 54.6% |
| Argentineans | 17.5 /100 | #197 | Poor 54.5% |
| Carpatho Rusyns | 16.2 /100 | #198 | Poor 54.4% |
| Immigrants | Norway | 15.9 /100 | #199 | Poor 54.4% |
| Houma | 15.8 /100 | #200 | Poor 54.4% |
| Immigrants | Italy | 15.5 /100 | #201 | Poor 54.4% |
| Immigrants | North Macedonia | 14.9 /100 | #202 | Poor 54.4% |
| Immigrants | Peru | 14.3 /100 | #203 | Poor 54.4% |
| Immigrants | Belgium | 13.7 /100 | #204 | Poor 54.3% |
| Cheyenne | 13.6 /100 | #205 | Poor 54.3% |