Irish vs Icelander 4 or more Vehicles in Household
COMPARE
Irish
Icelander
4 or more Vehicles in Household
4 or more Vehicles in Household Comparison
Irish
Icelanders
7.1%
4 OR MORE VEHICLES IN HOUSEHOLD
99.0/ 100
METRIC RATING
98th/ 347
METRIC RANK
7.4%
4 OR MORE VEHICLES IN HOUSEHOLD
99.9/ 100
METRIC RATING
74th/ 347
METRIC RANK
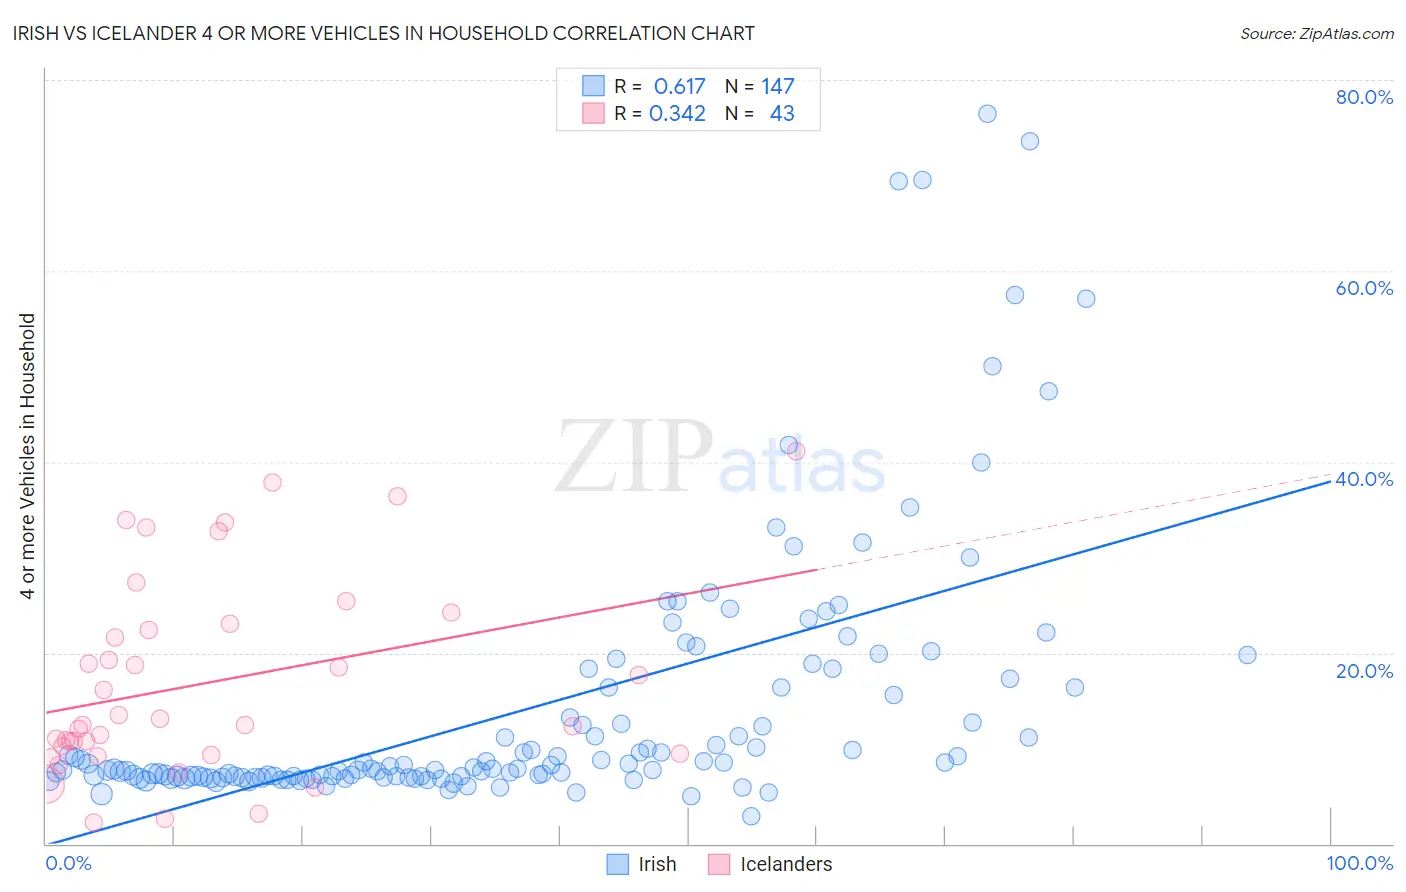
Irish vs Icelander 4 or more Vehicles in Household Correlation Chart
The statistical analysis conducted on geographies consisting of 576,295,994 people shows a significant positive correlation between the proportion of Irish and percentage of households with 4 or more vehicles available in the United States with a correlation coefficient (R) of 0.617 and weighted average of 7.1%. Similarly, the statistical analysis conducted on geographies consisting of 159,406,151 people shows a mild positive correlation between the proportion of Icelanders and percentage of households with 4 or more vehicles available in the United States with a correlation coefficient (R) of 0.342 and weighted average of 7.4%, a difference of 4.6%.
4 or more Vehicles in Household Correlation Summary
| Measurement | Irish | Icelander |
| Minimum | 2.8% | 2.3% |
| Maximum | 76.5% | 41.2% |
| Range | 73.6% | 38.9% |
| Mean | 14.2% | 16.9% |
| Median | 7.9% | 12.5% |
| Interquartile 25% (IQ1) | 7.0% | 9.5% |
| Interquartile 75% (IQ3) | 16.4% | 23.1% |
| Interquartile Range (IQR) | 9.4% | 13.6% |
| Standard Deviation (Sample) | 14.0% | 10.3% |
| Standard Deviation (Population) | 14.0% | 10.2% |
Similar Demographics by 4 or more Vehicles in Household
Demographics Similar to Irish by 4 or more Vehicles in Household
In terms of 4 or more vehicles in household, the demographic groups most similar to Irish are Celtic (7.1%, a difference of 0.42%), Seminole (7.0%, a difference of 0.44%), Taiwanese (7.0%, a difference of 0.52%), Pakistani (7.0%, a difference of 0.59%), and Asian (7.0%, a difference of 0.66%).
| Demographics | Rating | Rank | 4 or more Vehicles in Household |
| Assyrians/Chaldeans/Syriacs | 99.4 /100 | #91 | Exceptional 7.2% |
| Immigrants | Latin America | 99.4 /100 | #92 | Exceptional 7.1% |
| Immigrants | Afghanistan | 99.3 /100 | #93 | Exceptional 7.1% |
| Dutch West Indians | 99.3 /100 | #94 | Exceptional 7.1% |
| Czechoslovakians | 99.3 /100 | #95 | Exceptional 7.1% |
| Central Americans | 99.3 /100 | #96 | Exceptional 7.1% |
| Celtics | 99.1 /100 | #97 | Exceptional 7.1% |
| Irish | 99.0 /100 | #98 | Exceptional 7.1% |
| Seminole | 98.8 /100 | #99 | Exceptional 7.0% |
| Taiwanese | 98.7 /100 | #100 | Exceptional 7.0% |
| Pakistanis | 98.7 /100 | #101 | Exceptional 7.0% |
| Asians | 98.6 /100 | #102 | Exceptional 7.0% |
| Blackfeet | 98.6 /100 | #103 | Exceptional 7.0% |
| Hmong | 98.3 /100 | #104 | Exceptional 7.0% |
| German Russians | 98.3 /100 | #105 | Exceptional 7.0% |
Demographics Similar to Icelanders by 4 or more Vehicles in Household
In terms of 4 or more vehicles in household, the demographic groups most similar to Icelanders are Immigrants from Cambodia (7.4%, a difference of 0.0%), Laotian (7.4%, a difference of 0.050%), Apache (7.4%, a difference of 0.22%), White/Caucasian (7.4%, a difference of 0.29%), and Portuguese (7.4%, a difference of 0.30%).
| Demographics | Rating | Rank | 4 or more Vehicles in Household |
| Americans | 99.9 /100 | #67 | Exceptional 7.5% |
| Welsh | 99.9 /100 | #68 | Exceptional 7.5% |
| Germans | 99.9 /100 | #69 | Exceptional 7.5% |
| Scottish | 99.9 /100 | #70 | Exceptional 7.4% |
| Chickasaw | 99.9 /100 | #71 | Exceptional 7.4% |
| Scotch-Irish | 99.9 /100 | #72 | Exceptional 7.4% |
| Portuguese | 99.9 /100 | #73 | Exceptional 7.4% |
| Icelanders | 99.9 /100 | #74 | Exceptional 7.4% |
| Immigrants | Cambodia | 99.9 /100 | #75 | Exceptional 7.4% |
| Laotians | 99.9 /100 | #76 | Exceptional 7.4% |
| Apache | 99.9 /100 | #77 | Exceptional 7.4% |
| Whites/Caucasians | 99.8 /100 | #78 | Exceptional 7.4% |
| Czechs | 99.8 /100 | #79 | Exceptional 7.4% |
| Alaska Natives | 99.8 /100 | #80 | Exceptional 7.3% |
| Finns | 99.8 /100 | #81 | Exceptional 7.3% |