Irish vs English 4 or more Vehicles in Household
COMPARE
Irish
English
4 or more Vehicles in Household
4 or more Vehicles in Household Comparison
Irish
English
7.1%
4 OR MORE VEHICLES IN HOUSEHOLD
99.0/ 100
METRIC RATING
98th/ 347
METRIC RANK
7.6%
4 OR MORE VEHICLES IN HOUSEHOLD
100.0/ 100
METRIC RATING
56th/ 347
METRIC RANK
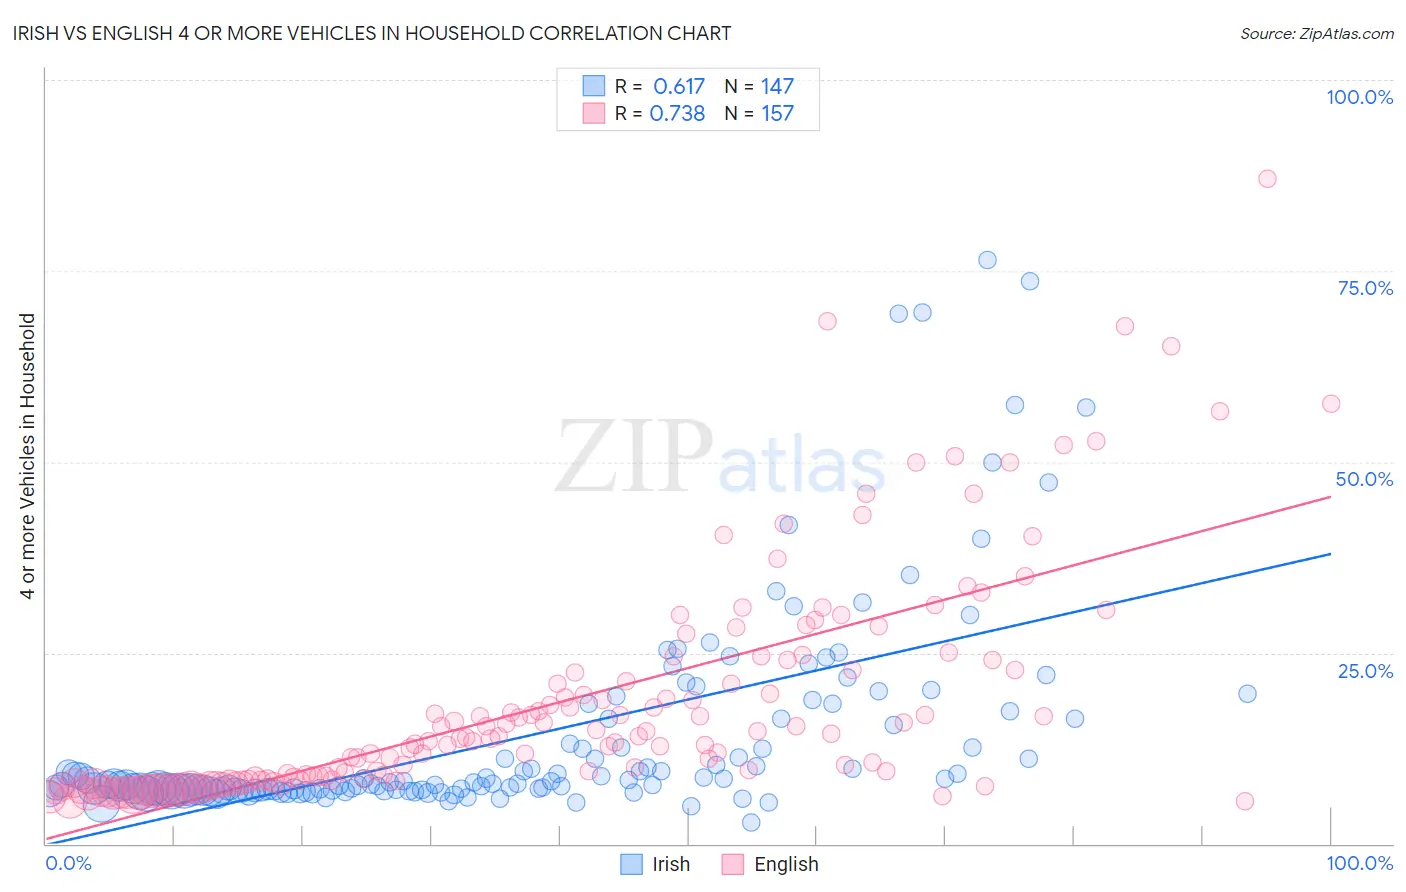
Irish vs English 4 or more Vehicles in Household Correlation Chart
The statistical analysis conducted on geographies consisting of 576,295,994 people shows a significant positive correlation between the proportion of Irish and percentage of households with 4 or more vehicles available in the United States with a correlation coefficient (R) of 0.617 and weighted average of 7.1%. Similarly, the statistical analysis conducted on geographies consisting of 575,671,099 people shows a strong positive correlation between the proportion of English and percentage of households with 4 or more vehicles available in the United States with a correlation coefficient (R) of 0.738 and weighted average of 7.6%, a difference of 8.1%.
4 or more Vehicles in Household Correlation Summary
| Measurement | Irish | English |
| Minimum | 2.8% | 5.6% |
| Maximum | 76.5% | 87.1% |
| Range | 73.6% | 81.5% |
| Mean | 14.2% | 18.6% |
| Median | 7.9% | 13.7% |
| Interquartile 25% (IQ1) | 7.0% | 8.3% |
| Interquartile 75% (IQ3) | 16.4% | 22.8% |
| Interquartile Range (IQR) | 9.4% | 14.5% |
| Standard Deviation (Sample) | 14.0% | 14.8% |
| Standard Deviation (Population) | 14.0% | 14.8% |
Similar Demographics by 4 or more Vehicles in Household
Demographics Similar to Irish by 4 or more Vehicles in Household
In terms of 4 or more vehicles in household, the demographic groups most similar to Irish are Celtic (7.1%, a difference of 0.42%), Seminole (7.0%, a difference of 0.44%), Taiwanese (7.0%, a difference of 0.52%), Pakistani (7.0%, a difference of 0.59%), and Asian (7.0%, a difference of 0.66%).
| Demographics | Rating | Rank | 4 or more Vehicles in Household |
| Assyrians/Chaldeans/Syriacs | 99.4 /100 | #91 | Exceptional 7.2% |
| Immigrants | Latin America | 99.4 /100 | #92 | Exceptional 7.1% |
| Immigrants | Afghanistan | 99.3 /100 | #93 | Exceptional 7.1% |
| Dutch West Indians | 99.3 /100 | #94 | Exceptional 7.1% |
| Czechoslovakians | 99.3 /100 | #95 | Exceptional 7.1% |
| Central Americans | 99.3 /100 | #96 | Exceptional 7.1% |
| Celtics | 99.1 /100 | #97 | Exceptional 7.1% |
| Irish | 99.0 /100 | #98 | Exceptional 7.1% |
| Seminole | 98.8 /100 | #99 | Exceptional 7.0% |
| Taiwanese | 98.7 /100 | #100 | Exceptional 7.0% |
| Pakistanis | 98.7 /100 | #101 | Exceptional 7.0% |
| Asians | 98.6 /100 | #102 | Exceptional 7.0% |
| Blackfeet | 98.6 /100 | #103 | Exceptional 7.0% |
| Hmong | 98.3 /100 | #104 | Exceptional 7.0% |
| German Russians | 98.3 /100 | #105 | Exceptional 7.0% |
Demographics Similar to English by 4 or more Vehicles in Household
In terms of 4 or more vehicles in household, the demographic groups most similar to English are Immigrants from Oceania (7.6%, a difference of 0.010%), Pennsylvania German (7.6%, a difference of 0.12%), Swedish (7.6%, a difference of 0.12%), Hispanic or Latino (7.6%, a difference of 0.16%), and Spaniard (7.6%, a difference of 0.22%).
| Demographics | Rating | Rank | 4 or more Vehicles in Household |
| Cherokee | 100.0 /100 | #49 | Exceptional 7.7% |
| Immigrants | El Salvador | 100.0 /100 | #50 | Exceptional 7.7% |
| Immigrants | Laos | 100.0 /100 | #51 | Exceptional 7.7% |
| Japanese | 100.0 /100 | #52 | Exceptional 7.7% |
| Malaysians | 100.0 /100 | #53 | Exceptional 7.7% |
| Dutch | 100.0 /100 | #54 | Exceptional 7.7% |
| Immigrants | Oceania | 100.0 /100 | #55 | Exceptional 7.6% |
| English | 100.0 /100 | #56 | Exceptional 7.6% |
| Pennsylvania Germans | 100.0 /100 | #57 | Exceptional 7.6% |
| Swedes | 100.0 /100 | #58 | Exceptional 7.6% |
| Hispanics or Latinos | 100.0 /100 | #59 | Exceptional 7.6% |
| Spaniards | 100.0 /100 | #60 | Exceptional 7.6% |
| Europeans | 100.0 /100 | #61 | Exceptional 7.6% |
| Chippewa | 100.0 /100 | #62 | Exceptional 7.6% |
| Immigrants | Micronesia | 100.0 /100 | #63 | Exceptional 7.6% |