Irish vs Nepalese 4 or more Vehicles in Household
COMPARE
Irish
Nepalese
4 or more Vehicles in Household
4 or more Vehicles in Household Comparison
Irish
Nepalese
7.1%
4 OR MORE VEHICLES IN HOUSEHOLD
99.0/ 100
METRIC RATING
98th/ 347
METRIC RANK
8.7%
4 OR MORE VEHICLES IN HOUSEHOLD
100.0/ 100
METRIC RATING
18th/ 347
METRIC RANK
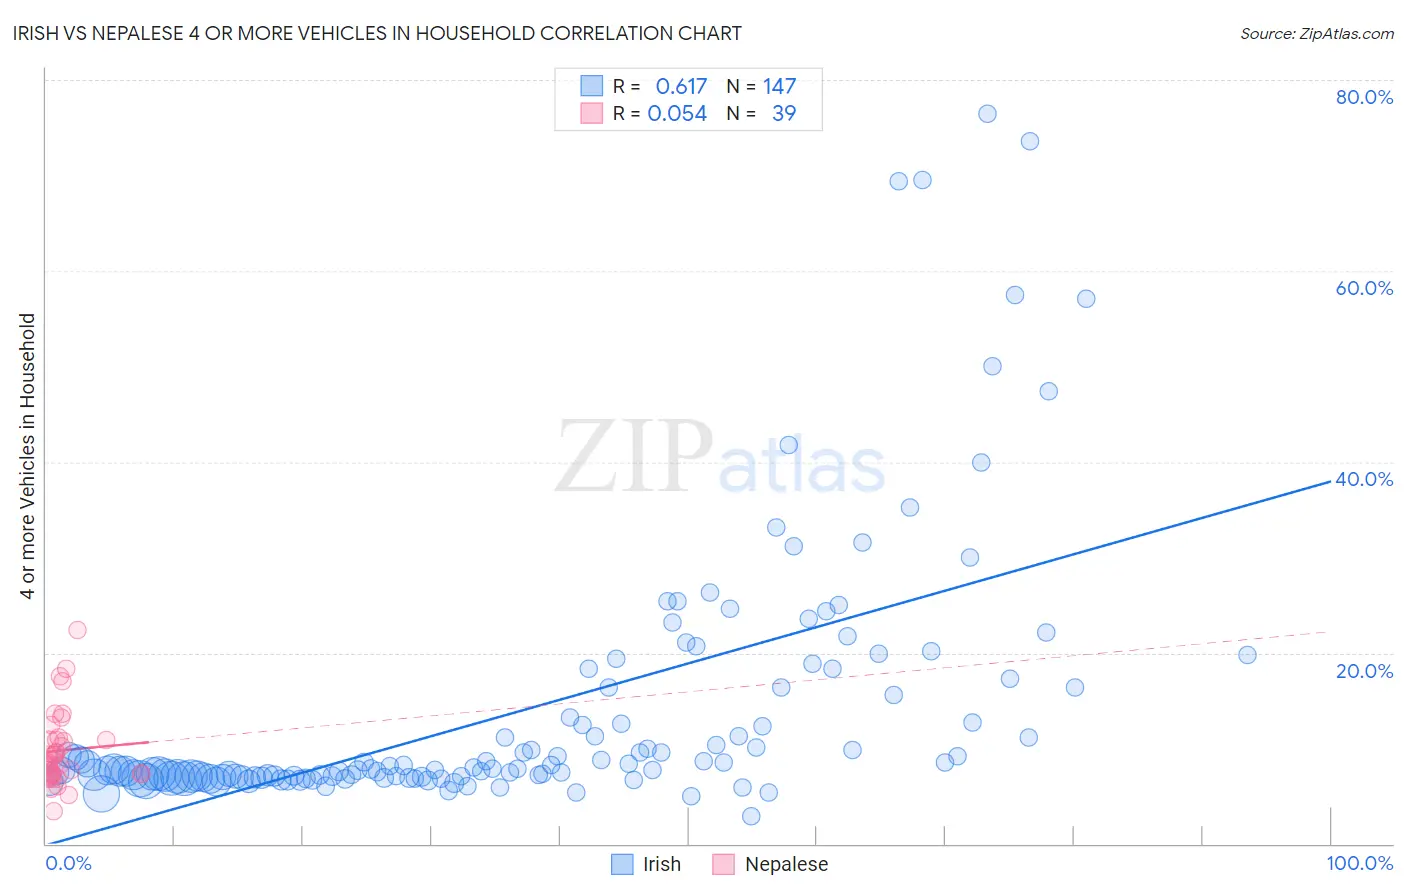
Irish vs Nepalese 4 or more Vehicles in Household Correlation Chart
The statistical analysis conducted on geographies consisting of 576,295,994 people shows a significant positive correlation between the proportion of Irish and percentage of households with 4 or more vehicles available in the United States with a correlation coefficient (R) of 0.617 and weighted average of 7.1%. Similarly, the statistical analysis conducted on geographies consisting of 24,517,800 people shows a slight positive correlation between the proportion of Nepalese and percentage of households with 4 or more vehicles available in the United States with a correlation coefficient (R) of 0.054 and weighted average of 8.7%, a difference of 23.9%.
4 or more Vehicles in Household Correlation Summary
| Measurement | Irish | Nepalese |
| Minimum | 2.8% | 3.4% |
| Maximum | 76.5% | 22.4% |
| Range | 73.6% | 19.1% |
| Mean | 14.2% | 9.8% |
| Median | 7.9% | 8.8% |
| Interquartile 25% (IQ1) | 7.0% | 7.2% |
| Interquartile 75% (IQ3) | 16.4% | 10.9% |
| Interquartile Range (IQR) | 9.4% | 3.7% |
| Standard Deviation (Sample) | 14.0% | 3.9% |
| Standard Deviation (Population) | 14.0% | 3.9% |
Similar Demographics by 4 or more Vehicles in Household
Demographics Similar to Irish by 4 or more Vehicles in Household
In terms of 4 or more vehicles in household, the demographic groups most similar to Irish are Celtic (7.1%, a difference of 0.42%), Seminole (7.0%, a difference of 0.44%), Taiwanese (7.0%, a difference of 0.52%), Pakistani (7.0%, a difference of 0.59%), and Asian (7.0%, a difference of 0.66%).
| Demographics | Rating | Rank | 4 or more Vehicles in Household |
| Assyrians/Chaldeans/Syriacs | 99.4 /100 | #91 | Exceptional 7.2% |
| Immigrants | Latin America | 99.4 /100 | #92 | Exceptional 7.1% |
| Immigrants | Afghanistan | 99.3 /100 | #93 | Exceptional 7.1% |
| Dutch West Indians | 99.3 /100 | #94 | Exceptional 7.1% |
| Czechoslovakians | 99.3 /100 | #95 | Exceptional 7.1% |
| Central Americans | 99.3 /100 | #96 | Exceptional 7.1% |
| Celtics | 99.1 /100 | #97 | Exceptional 7.1% |
| Irish | 99.0 /100 | #98 | Exceptional 7.1% |
| Seminole | 98.8 /100 | #99 | Exceptional 7.0% |
| Taiwanese | 98.7 /100 | #100 | Exceptional 7.0% |
| Pakistanis | 98.7 /100 | #101 | Exceptional 7.0% |
| Asians | 98.6 /100 | #102 | Exceptional 7.0% |
| Blackfeet | 98.6 /100 | #103 | Exceptional 7.0% |
| Hmong | 98.3 /100 | #104 | Exceptional 7.0% |
| German Russians | 98.3 /100 | #105 | Exceptional 7.0% |
Demographics Similar to Nepalese by 4 or more Vehicles in Household
In terms of 4 or more vehicles in household, the demographic groups most similar to Nepalese are Ute (8.8%, a difference of 0.10%), Lumbee (8.8%, a difference of 0.43%), Shoshone (8.8%, a difference of 1.1%), Korean (8.6%, a difference of 1.1%), and Chinese (8.8%, a difference of 1.2%).
| Demographics | Rating | Rank | 4 or more Vehicles in Household |
| Immigrants | Mexico | 100.0 /100 | #11 | Exceptional 9.0% |
| Mexicans | 100.0 /100 | #12 | Exceptional 8.9% |
| Hawaiians | 100.0 /100 | #13 | Exceptional 8.9% |
| Chinese | 100.0 /100 | #14 | Exceptional 8.8% |
| Shoshone | 100.0 /100 | #15 | Exceptional 8.8% |
| Lumbee | 100.0 /100 | #16 | Exceptional 8.8% |
| Ute | 100.0 /100 | #17 | Exceptional 8.8% |
| Nepalese | 100.0 /100 | #18 | Exceptional 8.7% |
| Koreans | 100.0 /100 | #19 | Exceptional 8.6% |
| Pueblo | 100.0 /100 | #20 | Exceptional 8.6% |
| Danes | 100.0 /100 | #21 | Exceptional 8.6% |
| Immigrants | Vietnam | 100.0 /100 | #22 | Exceptional 8.6% |
| Immigrants | Philippines | 100.0 /100 | #23 | Exceptional 8.5% |
| Immigrants | Central America | 100.0 /100 | #24 | Exceptional 8.5% |
| Basques | 100.0 /100 | #25 | Exceptional 8.4% |