Irish vs Ecuadorian 4 or more Vehicles in Household
COMPARE
Irish
Ecuadorian
4 or more Vehicles in Household
4 or more Vehicles in Household Comparison
Irish
Ecuadorians
7.1%
4 OR MORE VEHICLES IN HOUSEHOLD
99.0/ 100
METRIC RATING
98th/ 347
METRIC RANK
4.5%
4 OR MORE VEHICLES IN HOUSEHOLD
0.0/ 100
METRIC RATING
321st/ 347
METRIC RANK
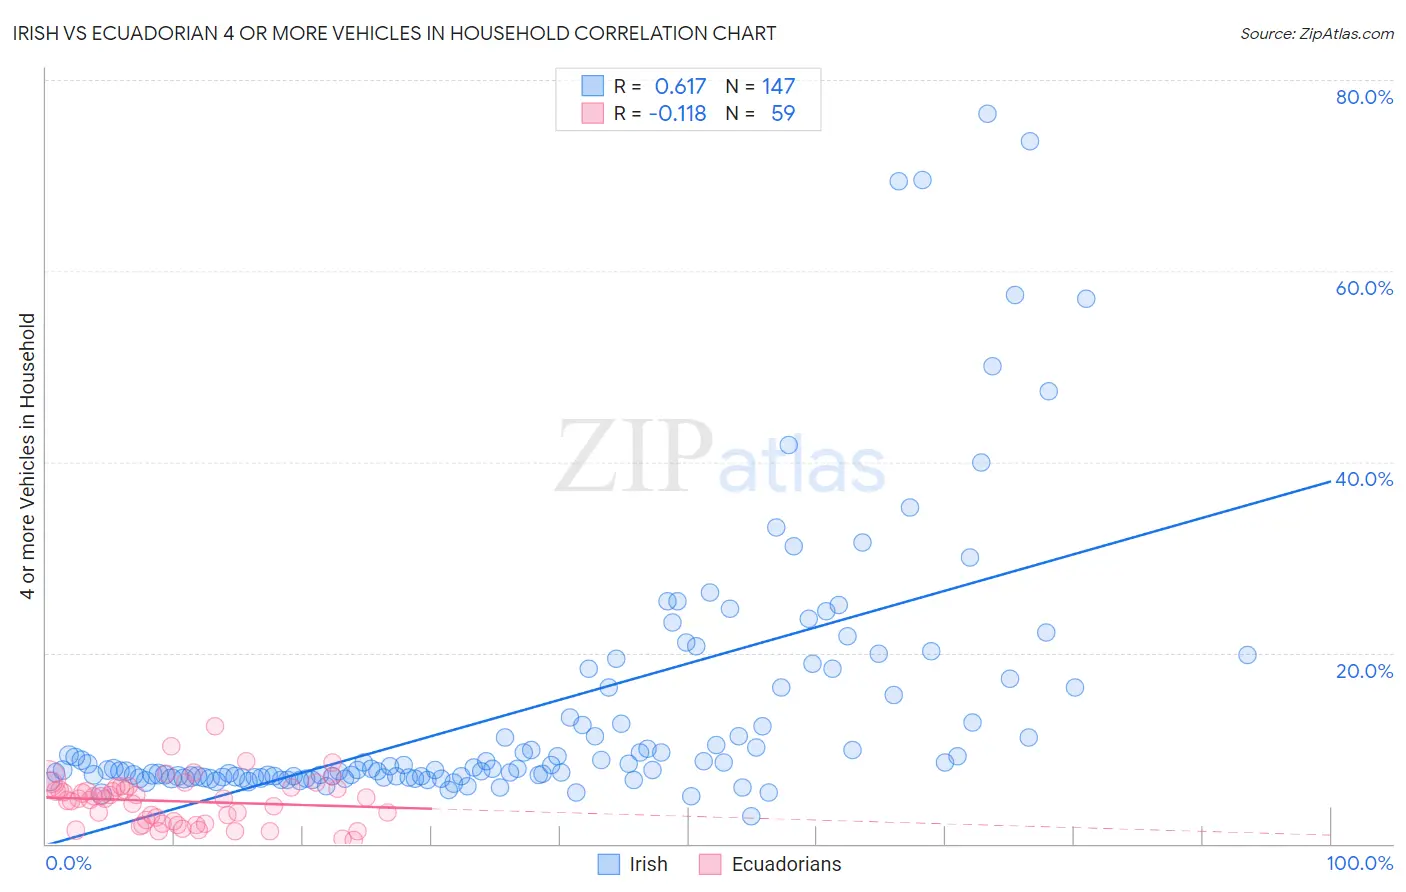
Irish vs Ecuadorian 4 or more Vehicles in Household Correlation Chart
The statistical analysis conducted on geographies consisting of 576,295,994 people shows a significant positive correlation between the proportion of Irish and percentage of households with 4 or more vehicles available in the United States with a correlation coefficient (R) of 0.617 and weighted average of 7.1%. Similarly, the statistical analysis conducted on geographies consisting of 316,107,100 people shows a poor negative correlation between the proportion of Ecuadorians and percentage of households with 4 or more vehicles available in the United States with a correlation coefficient (R) of -0.118 and weighted average of 4.5%, a difference of 58.1%.
4 or more Vehicles in Household Correlation Summary
| Measurement | Irish | Ecuadorian |
| Minimum | 2.8% | 0.44% |
| Maximum | 76.5% | 12.3% |
| Range | 73.6% | 11.9% |
| Mean | 14.2% | 4.4% |
| Median | 7.9% | 4.7% |
| Interquartile 25% (IQ1) | 7.0% | 2.1% |
| Interquartile 75% (IQ3) | 16.4% | 5.9% |
| Interquartile Range (IQR) | 9.4% | 3.8% |
| Standard Deviation (Sample) | 14.0% | 2.4% |
| Standard Deviation (Population) | 14.0% | 2.4% |
Similar Demographics by 4 or more Vehicles in Household
Demographics Similar to Irish by 4 or more Vehicles in Household
In terms of 4 or more vehicles in household, the demographic groups most similar to Irish are Celtic (7.1%, a difference of 0.42%), Seminole (7.0%, a difference of 0.44%), Taiwanese (7.0%, a difference of 0.52%), Pakistani (7.0%, a difference of 0.59%), and Asian (7.0%, a difference of 0.66%).
| Demographics | Rating | Rank | 4 or more Vehicles in Household |
| Assyrians/Chaldeans/Syriacs | 99.4 /100 | #91 | Exceptional 7.2% |
| Immigrants | Latin America | 99.4 /100 | #92 | Exceptional 7.1% |
| Immigrants | Afghanistan | 99.3 /100 | #93 | Exceptional 7.1% |
| Dutch West Indians | 99.3 /100 | #94 | Exceptional 7.1% |
| Czechoslovakians | 99.3 /100 | #95 | Exceptional 7.1% |
| Central Americans | 99.3 /100 | #96 | Exceptional 7.1% |
| Celtics | 99.1 /100 | #97 | Exceptional 7.1% |
| Irish | 99.0 /100 | #98 | Exceptional 7.1% |
| Seminole | 98.8 /100 | #99 | Exceptional 7.0% |
| Taiwanese | 98.7 /100 | #100 | Exceptional 7.0% |
| Pakistanis | 98.7 /100 | #101 | Exceptional 7.0% |
| Asians | 98.6 /100 | #102 | Exceptional 7.0% |
| Blackfeet | 98.6 /100 | #103 | Exceptional 7.0% |
| Hmong | 98.3 /100 | #104 | Exceptional 7.0% |
| German Russians | 98.3 /100 | #105 | Exceptional 7.0% |
Demographics Similar to Ecuadorians by 4 or more Vehicles in Household
In terms of 4 or more vehicles in household, the demographic groups most similar to Ecuadorians are Immigrants from Yemen (4.5%, a difference of 0.17%), Immigrants from Caribbean (4.4%, a difference of 0.58%), Immigrants from Haiti (4.5%, a difference of 0.75%), Soviet Union (4.4%, a difference of 0.86%), and Immigrants from Jamaica (4.4%, a difference of 1.2%).
| Demographics | Rating | Rank | 4 or more Vehicles in Household |
| Immigrants | West Indies | 0.0 /100 | #314 | Tragic 4.7% |
| Immigrants | Belarus | 0.0 /100 | #315 | Tragic 4.7% |
| Puerto Ricans | 0.0 /100 | #316 | Tragic 4.7% |
| U.S. Virgin Islanders | 0.0 /100 | #317 | Tragic 4.6% |
| Jamaicans | 0.0 /100 | #318 | Tragic 4.6% |
| Haitians | 0.0 /100 | #319 | Tragic 4.6% |
| Immigrants | Haiti | 0.0 /100 | #320 | Tragic 4.5% |
| Ecuadorians | 0.0 /100 | #321 | Tragic 4.5% |
| Immigrants | Yemen | 0.0 /100 | #322 | Tragic 4.5% |
| Immigrants | Caribbean | 0.0 /100 | #323 | Tragic 4.4% |
| Soviet Union | 0.0 /100 | #324 | Tragic 4.4% |
| Immigrants | Jamaica | 0.0 /100 | #325 | Tragic 4.4% |
| Cape Verdeans | 0.0 /100 | #326 | Tragic 4.4% |
| Senegalese | 0.0 /100 | #327 | Tragic 4.3% |
| Trinidadians and Tobagonians | 0.0 /100 | #328 | Tragic 4.3% |