Immigrants from West Indies vs Chickasaw 2 or more Vehicles in Household
COMPARE
Immigrants from West Indies
Chickasaw
2 or more Vehicles in Household
2 or more Vehicles in Household Comparison
Immigrants from West Indies
Chickasaw
43.1%
2 OR MORE VEHICLES IN HOUSEHOLD
0.0/ 100
METRIC RATING
325th/ 347
METRIC RANK
59.0%
2 OR MORE VEHICLES IN HOUSEHOLD
99.9/ 100
METRIC RATING
56th/ 347
METRIC RANK
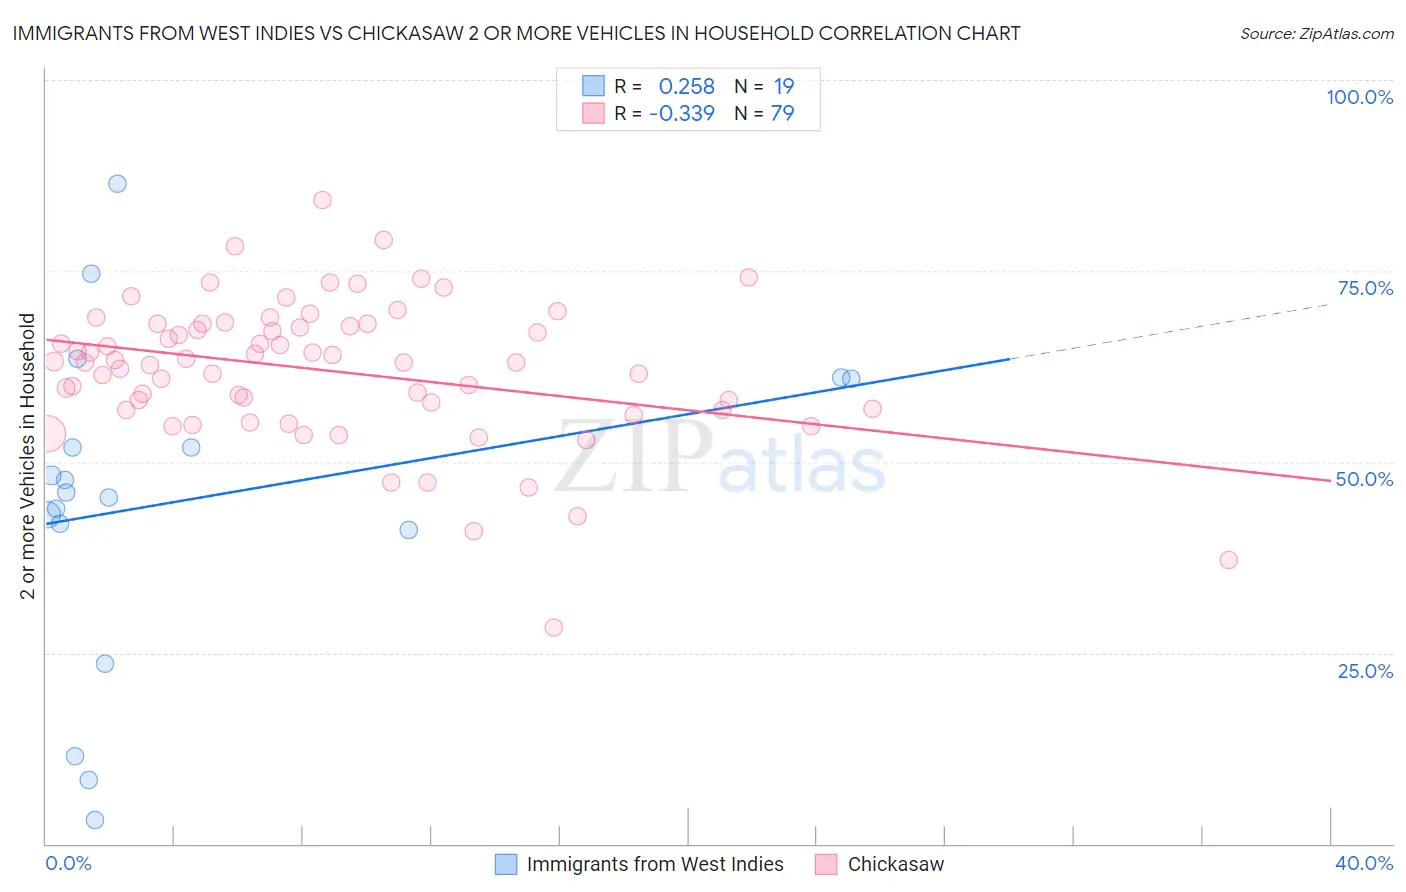
Immigrants from West Indies vs Chickasaw 2 or more Vehicles in Household Correlation Chart
The statistical analysis conducted on geographies consisting of 72,454,628 people shows a weak positive correlation between the proportion of Immigrants from West Indies and percentage of households with 2 or more vehicles available in the United States with a correlation coefficient (R) of 0.258 and weighted average of 43.1%. Similarly, the statistical analysis conducted on geographies consisting of 147,673,541 people shows a mild negative correlation between the proportion of Chickasaw and percentage of households with 2 or more vehicles available in the United States with a correlation coefficient (R) of -0.339 and weighted average of 59.0%, a difference of 36.9%.
2 or more Vehicles in Household Correlation Summary
| Measurement | Immigrants from West Indies | Chickasaw |
| Minimum | 3.0% | 28.3% |
| Maximum | 86.4% | 84.2% |
| Range | 83.3% | 56.0% |
| Mean | 44.9% | 61.9% |
| Median | 46.0% | 63.1% |
| Interquartile 25% (IQ1) | 41.1% | 56.8% |
| Interquartile 75% (IQ3) | 61.0% | 68.0% |
| Interquartile Range (IQR) | 19.8% | 11.2% |
| Standard Deviation (Sample) | 21.4% | 9.3% |
| Standard Deviation (Population) | 20.9% | 9.3% |
Similar Demographics by 2 or more Vehicles in Household
Demographics Similar to Immigrants from West Indies by 2 or more Vehicles in Household
In terms of 2 or more vehicles in household, the demographic groups most similar to Immigrants from West Indies are Immigrants from Senegal (43.0%, a difference of 0.15%), Immigrants from Yemen (42.8%, a difference of 0.56%), Immigrants from Cabo Verde (43.3%, a difference of 0.57%), Inupiat (42.6%, a difference of 1.1%), and Immigrants from Caribbean (44.2%, a difference of 2.6%).
| Demographics | Rating | Rank | 2 or more Vehicles in Household |
| Immigrants | Albania | 0.0 /100 | #318 | Tragic 46.0% |
| Jamaicans | 0.0 /100 | #319 | Tragic 45.8% |
| Soviet Union | 0.0 /100 | #320 | Tragic 45.7% |
| Immigrants | Jamaica | 0.0 /100 | #321 | Tragic 44.5% |
| Senegalese | 0.0 /100 | #322 | Tragic 44.2% |
| Immigrants | Caribbean | 0.0 /100 | #323 | Tragic 44.2% |
| Immigrants | Cabo Verde | 0.0 /100 | #324 | Tragic 43.3% |
| Immigrants | West Indies | 0.0 /100 | #325 | Tragic 43.1% |
| Immigrants | Senegal | 0.0 /100 | #326 | Tragic 43.0% |
| Immigrants | Yemen | 0.0 /100 | #327 | Tragic 42.8% |
| Inupiat | 0.0 /100 | #328 | Tragic 42.6% |
| Ecuadorians | 0.0 /100 | #329 | Tragic 42.0% |
| Immigrants | Dominica | 0.0 /100 | #330 | Tragic 41.6% |
| West Indians | 0.0 /100 | #331 | Tragic 41.3% |
| Trinidadians and Tobagonians | 0.0 /100 | #332 | Tragic 40.9% |
Demographics Similar to Chickasaw by 2 or more Vehicles in Household
In terms of 2 or more vehicles in household, the demographic groups most similar to Chickasaw are Afghan (59.0%, a difference of 0.0%), Luxembourger (59.1%, a difference of 0.11%), Bhutanese (59.1%, a difference of 0.14%), Immigrants from Scotland (58.9%, a difference of 0.19%), and Spanish American (58.9%, a difference of 0.21%).
| Demographics | Rating | Rank | 2 or more Vehicles in Household |
| Belgians | 99.9 /100 | #49 | Exceptional 59.3% |
| Choctaw | 99.9 /100 | #50 | Exceptional 59.3% |
| Spaniards | 99.9 /100 | #51 | Exceptional 59.2% |
| Immigrants | Laos | 99.9 /100 | #52 | Exceptional 59.2% |
| Celtics | 99.9 /100 | #53 | Exceptional 59.2% |
| Bhutanese | 99.9 /100 | #54 | Exceptional 59.1% |
| Luxembourgers | 99.9 /100 | #55 | Exceptional 59.1% |
| Chickasaw | 99.9 /100 | #56 | Exceptional 59.0% |
| Afghans | 99.9 /100 | #57 | Exceptional 59.0% |
| Immigrants | Scotland | 99.8 /100 | #58 | Exceptional 58.9% |
| Spanish Americans | 99.8 /100 | #59 | Exceptional 58.9% |
| French Canadians | 99.8 /100 | #60 | Exceptional 58.9% |
| Osage | 99.8 /100 | #61 | Exceptional 58.8% |
| Immigrants | Nonimmigrants | 99.8 /100 | #62 | Exceptional 58.8% |
| Mexican American Indians | 99.8 /100 | #63 | Exceptional 58.7% |