Immigrants from West Indies Married-couple Households
COMPARE
Immigrants from West Indies
Select to Compare
Married-couple Households
Immigrants from West Indies Married-couple Households
39.0%
MARRIED-COUPLE HOUSEHOLDS
0.0/ 100
METRIC RATING
333rd/ 347
METRIC RANK
Immigrants from West Indies Married-couple Households Correlation Chart
The statistical analysis conducted on geographies consisting of 72,454,628 people shows no correlation between the proportion of Immigrants from West Indies and percentage of married-couple family households in the United States with a correlation coefficient (R) of -0.033 and weighted average of 39.0%. On average, for every 1% (one percent) increase in Immigrants from West Indies within a typical geography, there is a decrease of 0.049% in percentage of married-couple family households.
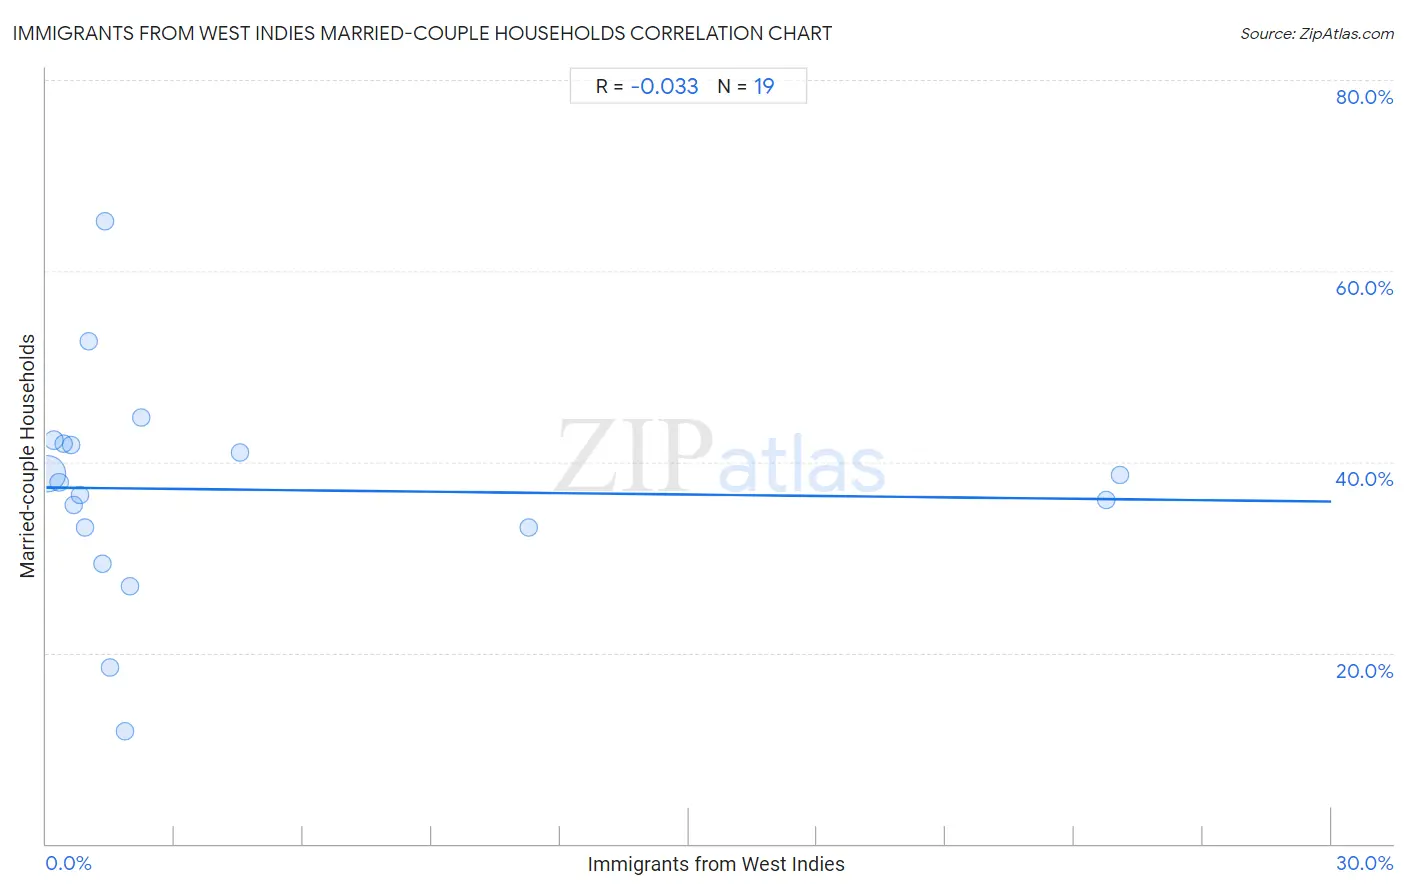
It is essential to understand that the correlation between the percentage of Immigrants from West Indies and percentage of married-couple family households does not imply a direct cause-and-effect relationship. It remains uncertain whether the presence of Immigrants from West Indies influences an upward or downward trend in the level of percentage of married-couple family households within an area, or if Immigrants from West Indies simply ended up residing in those areas with higher or lower levels of percentage of married-couple family households due to other factors.
Demographics Similar to Immigrants from West Indies by Married-couple Households
In terms of married-couple households, the demographic groups most similar to Immigrants from West Indies are Somali (39.0%, a difference of 0.030%), Immigrants from Congo (39.0%, a difference of 0.12%), Immigrants from Barbados (39.2%, a difference of 0.56%), Immigrants from St. Vincent and the Grenadines (38.7%, a difference of 0.78%), and Immigrants from Dominica (39.4%, a difference of 1.0%).
| Demographics | Rating | Rank | Married-couple Households |
| U.S. Virgin Islanders | 0.0 /100 | #326 | Tragic 39.8% |
| Lumbee | 0.0 /100 | #327 | Tragic 39.6% |
| Barbadians | 0.0 /100 | #328 | Tragic 39.4% |
| Immigrants from Dominica | 0.0 /100 | #329 | Tragic 39.4% |
| Immigrants from Barbados | 0.0 /100 | #330 | Tragic 39.2% |
| Immigrants from Congo | 0.0 /100 | #331 | Tragic 39.0% |
| Somalis | 0.0 /100 | #332 | Tragic 39.0% |
| Immigrants from West Indies | 0.0 /100 | #333 | Tragic 39.0% |
| Immigrants from St. Vincent and the Grenadines | 0.0 /100 | #334 | Tragic 38.7% |
| Senegalese | 0.0 /100 | #335 | Tragic 38.6% |
| Blacks/African Americans | 0.0 /100 | #336 | Tragic 38.5% |
| Immigrants from Somalia | 0.0 /100 | #337 | Tragic 38.4% |
| Immigrants from Senegal | 0.0 /100 | #338 | Tragic 38.4% |
| British West Indians | 0.0 /100 | #339 | Tragic 38.3% |
| Dominicans | 0.0 /100 | #340 | Tragic 38.2% |
Immigrants from West Indies Married-couple Households Correlation Summary
| Measurement | Immigrants from West Indies Data | Married-couple Households Data |
| Minimum | 0.030% | 11.8% |
| Maximum | 25.1% | 65.1% |
| Range | 25.0% | 53.3% |
| Mean | 4.2% | 37.1% |
| Median | 1.3% | 37.9% |
| Interquartile 25% (IQ1) | 0.58% | 33.1% |
| Interquartile 75% (IQ3) | 2.2% | 41.9% |
| Interquartile Range (IQR) | 1.6% | 8.8% |
| Standard Deviation (Sample) | 7.7% | 11.5% |
| Standard Deviation (Population) | 7.5% | 11.1% |
Correlation Details
| Immigrants from West Indies Percentile | Sample Size | Married-couple Households |
[ 0.0% - 0.5% ] 0.030% | 66,225,991 | 38.7% |
[ 0.0% - 0.5% ] 0.17% | 3,580,405 | 42.2% |
[ 0.0% - 0.5% ] 0.30% | 1,428,083 | 37.9% |
[ 0.0% - 0.5% ] 0.42% | 550,808 | 41.9% |
[ 0.5% - 1.0% ] 0.58% | 335,393 | 41.7% |
[ 0.5% - 1.0% ] 0.64% | 117,598 | 35.4% |
[ 0.5% - 1.0% ] 0.80% | 10,239 | 36.6% |
[ 0.5% - 1.0% ] 0.91% | 37,037 | 33.1% |
[ 0.5% - 1.0% ] 0.99% | 20,078 | 52.6% |
[ 1.0% - 1.5% ] 1.31% | 104,507 | 29.4% |
[ 1.0% - 1.5% ] 1.38% | 10,335 | 65.1% |
[ 1.0% - 1.5% ] 1.50% | 16,808 | 18.4% |
[ 1.5% - 2.0% ] 1.84% | 2,172 | 11.8% |
[ 1.5% - 2.0% ] 1.95% | 9,983 | 27.0% |
[ 2.0% - 2.5% ] 2.23% | 539 | 44.7% |
[ 4.5% - 5.0% ] 4.53% | 773 | 40.9% |
[ 11.0% - 11.5% ] 11.28% | 337 | 33.1% |
[ 24.5% - 25.0% ] 24.75% | 1,782 | 36.0% |
[ 25.0% - 25.5% ] 25.06% | 1,760 | 38.6% |