Immigrants from West Indies vs German 2 or more Vehicles in Household
COMPARE
Immigrants from West Indies
German
2 or more Vehicles in Household
2 or more Vehicles in Household Comparison
Immigrants from West Indies
Germans
43.1%
2 OR MORE VEHICLES IN HOUSEHOLD
0.0/ 100
METRIC RATING
325th/ 347
METRIC RANK
61.6%
2 OR MORE VEHICLES IN HOUSEHOLD
100.0/ 100
METRIC RATING
12th/ 347
METRIC RANK
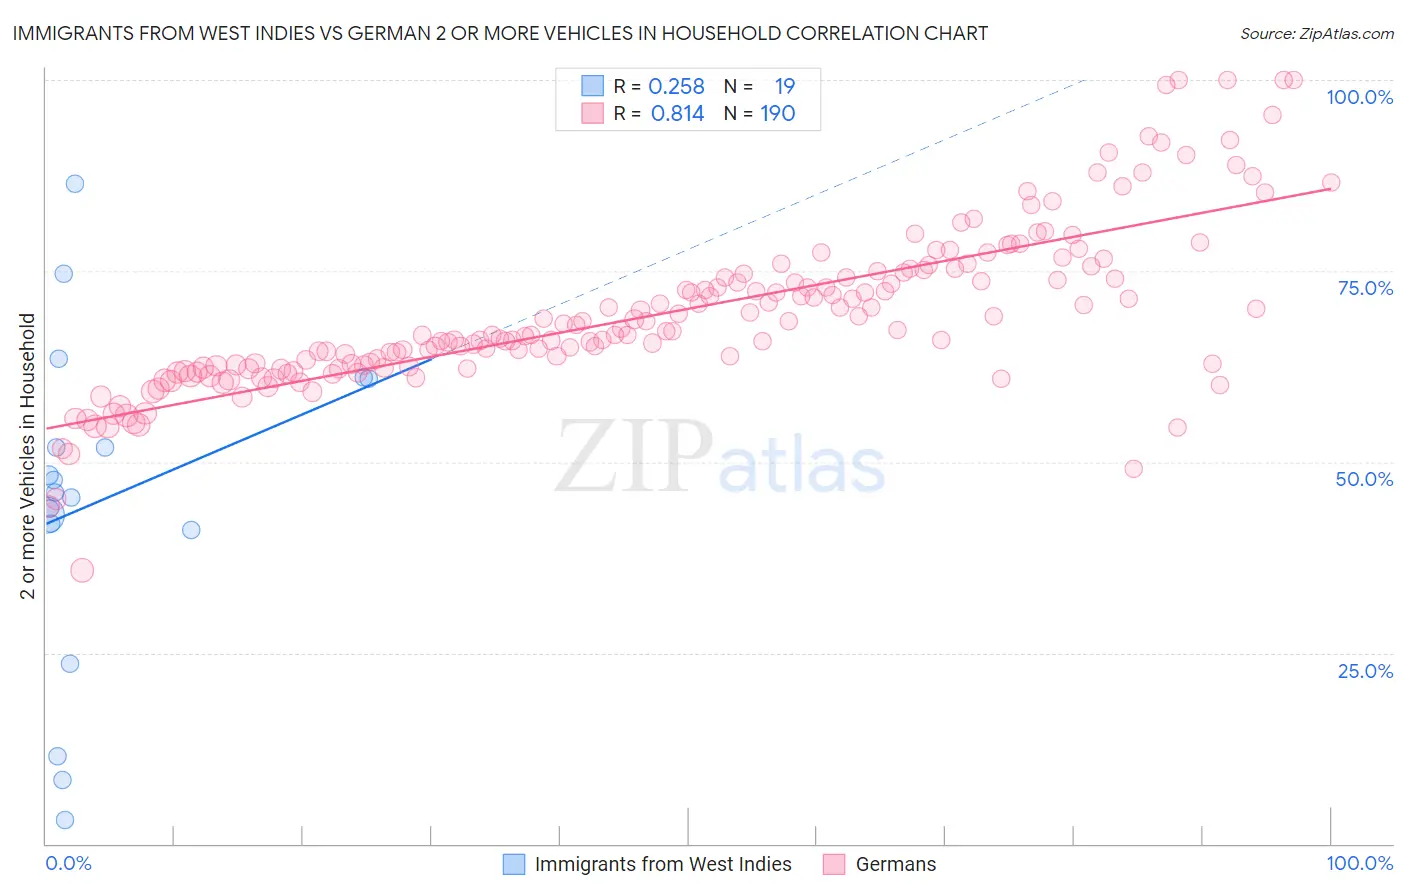
Immigrants from West Indies vs German 2 or more Vehicles in Household Correlation Chart
The statistical analysis conducted on geographies consisting of 72,454,628 people shows a weak positive correlation between the proportion of Immigrants from West Indies and percentage of households with 2 or more vehicles available in the United States with a correlation coefficient (R) of 0.258 and weighted average of 43.1%. Similarly, the statistical analysis conducted on geographies consisting of 580,661,137 people shows a very strong positive correlation between the proportion of Germans and percentage of households with 2 or more vehicles available in the United States with a correlation coefficient (R) of 0.814 and weighted average of 61.6%, a difference of 42.9%.
2 or more Vehicles in Household Correlation Summary
| Measurement | Immigrants from West Indies | German |
| Minimum | 3.0% | 35.8% |
| Maximum | 86.4% | 100.0% |
| Range | 83.3% | 64.2% |
| Mean | 44.9% | 69.3% |
| Median | 46.0% | 67.1% |
| Interquartile 25% (IQ1) | 41.1% | 62.3% |
| Interquartile 75% (IQ3) | 61.0% | 74.6% |
| Interquartile Range (IQR) | 19.8% | 12.3% |
| Standard Deviation (Sample) | 21.4% | 10.7% |
| Standard Deviation (Population) | 20.9% | 10.7% |
Similar Demographics by 2 or more Vehicles in Household
Demographics Similar to Immigrants from West Indies by 2 or more Vehicles in Household
In terms of 2 or more vehicles in household, the demographic groups most similar to Immigrants from West Indies are Immigrants from Senegal (43.0%, a difference of 0.15%), Immigrants from Yemen (42.8%, a difference of 0.56%), Immigrants from Cabo Verde (43.3%, a difference of 0.57%), Inupiat (42.6%, a difference of 1.1%), and Immigrants from Caribbean (44.2%, a difference of 2.6%).
| Demographics | Rating | Rank | 2 or more Vehicles in Household |
| Immigrants | Albania | 0.0 /100 | #318 | Tragic 46.0% |
| Jamaicans | 0.0 /100 | #319 | Tragic 45.8% |
| Soviet Union | 0.0 /100 | #320 | Tragic 45.7% |
| Immigrants | Jamaica | 0.0 /100 | #321 | Tragic 44.5% |
| Senegalese | 0.0 /100 | #322 | Tragic 44.2% |
| Immigrants | Caribbean | 0.0 /100 | #323 | Tragic 44.2% |
| Immigrants | Cabo Verde | 0.0 /100 | #324 | Tragic 43.3% |
| Immigrants | West Indies | 0.0 /100 | #325 | Tragic 43.1% |
| Immigrants | Senegal | 0.0 /100 | #326 | Tragic 43.0% |
| Immigrants | Yemen | 0.0 /100 | #327 | Tragic 42.8% |
| Inupiat | 0.0 /100 | #328 | Tragic 42.6% |
| Ecuadorians | 0.0 /100 | #329 | Tragic 42.0% |
| Immigrants | Dominica | 0.0 /100 | #330 | Tragic 41.6% |
| West Indians | 0.0 /100 | #331 | Tragic 41.3% |
| Trinidadians and Tobagonians | 0.0 /100 | #332 | Tragic 40.9% |
Demographics Similar to Germans by 2 or more Vehicles in Household
In terms of 2 or more vehicles in household, the demographic groups most similar to Germans are Dutch (61.6%, a difference of 0.11%), Samoan (61.5%, a difference of 0.12%), Czech (61.5%, a difference of 0.16%), Mexican (61.7%, a difference of 0.17%), and Nepalese (61.4%, a difference of 0.25%).
| Demographics | Rating | Rank | 2 or more Vehicles in Household |
| Immigrants | Fiji | 100.0 /100 | #5 | Exceptional 62.3% |
| Scandinavians | 100.0 /100 | #6 | Exceptional 62.1% |
| Puget Sound Salish | 100.0 /100 | #7 | Exceptional 62.1% |
| English | 100.0 /100 | #8 | Exceptional 61.9% |
| Swedes | 100.0 /100 | #9 | Exceptional 61.8% |
| Mexicans | 100.0 /100 | #10 | Exceptional 61.7% |
| Dutch | 100.0 /100 | #11 | Exceptional 61.6% |
| Germans | 100.0 /100 | #12 | Exceptional 61.6% |
| Samoans | 100.0 /100 | #13 | Exceptional 61.5% |
| Czechs | 100.0 /100 | #14 | Exceptional 61.5% |
| Nepalese | 100.0 /100 | #15 | Exceptional 61.4% |
| Native Hawaiians | 100.0 /100 | #16 | Exceptional 61.4% |
| Basques | 100.0 /100 | #17 | Exceptional 61.4% |
| Europeans | 100.0 /100 | #18 | Exceptional 61.4% |
| Scottish | 100.0 /100 | #19 | Exceptional 61.2% |