Immigrants from Northern Europe vs Immigrants from Western Europe 2 or more Vehicles in Household
COMPARE
Immigrants from Northern Europe
Immigrants from Western Europe
2 or more Vehicles in Household
2 or more Vehicles in Household Comparison
Immigrants from Northern Europe
Immigrants from Western Europe
56.1%
2 OR MORE VEHICLES IN HOUSEHOLD
78.7/ 100
METRIC RATING
151st/ 347
METRIC RANK
55.4%
2 OR MORE VEHICLES IN HOUSEHOLD
51.4/ 100
METRIC RATING
173rd/ 347
METRIC RANK
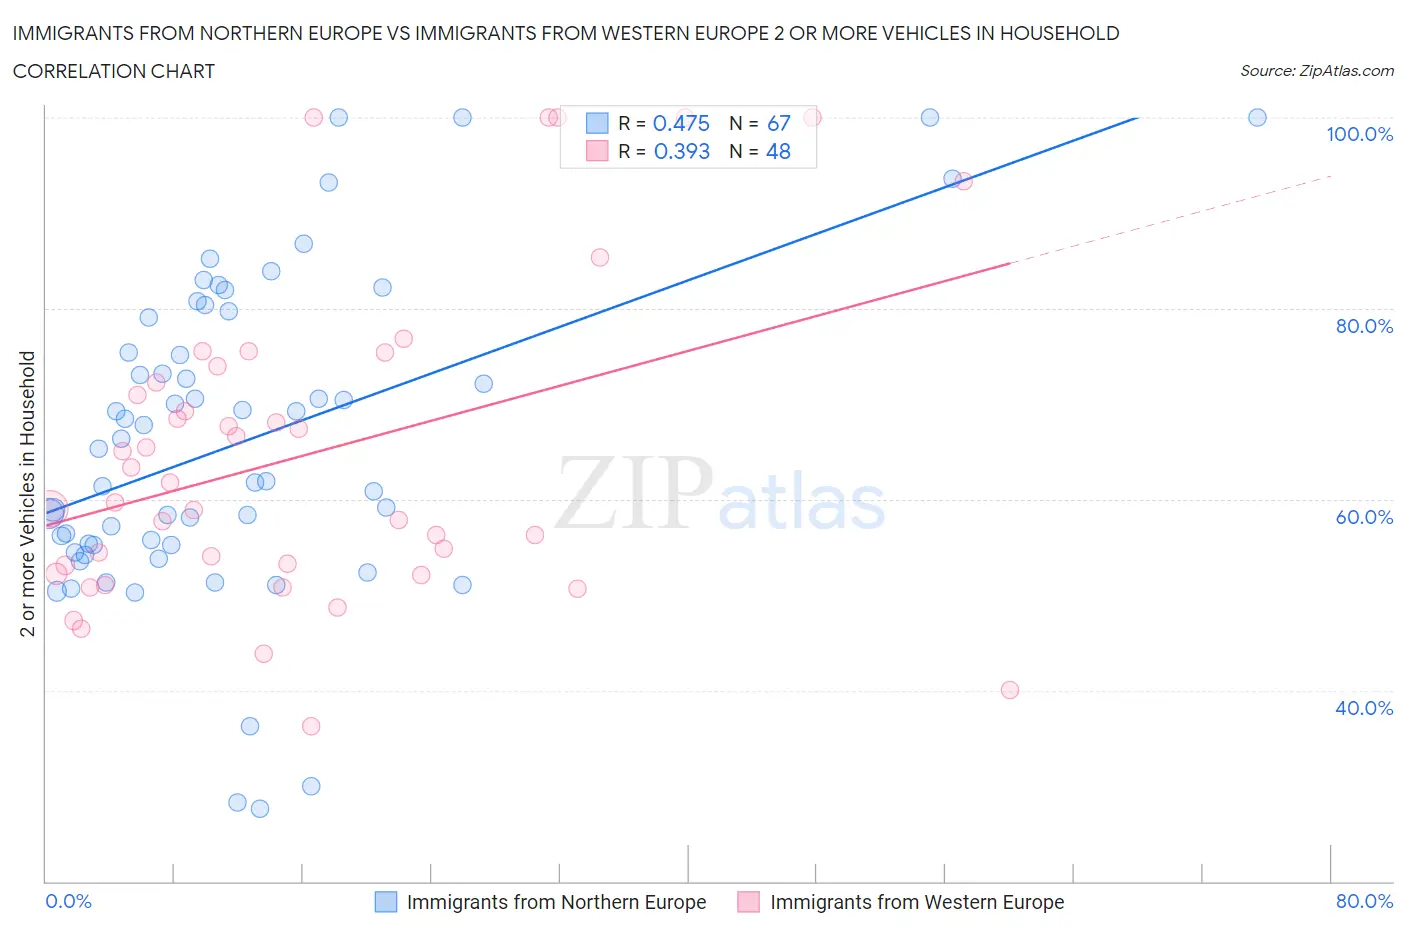
Immigrants from Northern Europe vs Immigrants from Western Europe 2 or more Vehicles in Household Correlation Chart
The statistical analysis conducted on geographies consisting of 476,975,889 people shows a moderate positive correlation between the proportion of Immigrants from Northern Europe and percentage of households with 2 or more vehicles available in the United States with a correlation coefficient (R) of 0.475 and weighted average of 56.1%. Similarly, the statistical analysis conducted on geographies consisting of 493,846,859 people shows a mild positive correlation between the proportion of Immigrants from Western Europe and percentage of households with 2 or more vehicles available in the United States with a correlation coefficient (R) of 0.393 and weighted average of 55.4%, a difference of 1.3%.
2 or more Vehicles in Household Correlation Summary
| Measurement | Immigrants from Northern Europe | Immigrants from Western Europe |
| Minimum | 27.6% | 36.3% |
| Maximum | 100.0% | 100.0% |
| Range | 72.4% | 63.7% |
| Mean | 66.1% | 64.7% |
| Median | 65.3% | 60.8% |
| Interquartile 25% (IQ1) | 55.2% | 52.7% |
| Interquartile 75% (IQ3) | 79.1% | 73.1% |
| Interquartile Range (IQR) | 23.9% | 20.5% |
| Standard Deviation (Sample) | 16.6% | 16.6% |
| Standard Deviation (Population) | 16.5% | 16.4% |
Similar Demographics by 2 or more Vehicles in Household
Demographics Similar to Immigrants from Northern Europe by 2 or more Vehicles in Household
In terms of 2 or more vehicles in household, the demographic groups most similar to Immigrants from Northern Europe are Immigrants from Pakistan (56.1%, a difference of 0.030%), Nicaraguan (56.1%, a difference of 0.070%), Immigrants from Moldova (56.1%, a difference of 0.090%), Chilean (56.1%, a difference of 0.090%), and Serbian (56.1%, a difference of 0.10%).
| Demographics | Rating | Rank | 2 or more Vehicles in Household |
| Immigrants | Syria | 81.4 /100 | #144 | Excellent 56.2% |
| Syrians | 81.2 /100 | #145 | Excellent 56.2% |
| Venezuelans | 80.7 /100 | #146 | Excellent 56.1% |
| Serbians | 80.3 /100 | #147 | Excellent 56.1% |
| Immigrants | Moldova | 80.2 /100 | #148 | Excellent 56.1% |
| Chileans | 80.2 /100 | #149 | Excellent 56.1% |
| Nicaraguans | 79.9 /100 | #150 | Good 56.1% |
| Immigrants | Northern Europe | 78.7 /100 | #151 | Good 56.1% |
| Immigrants | Pakistan | 78.1 /100 | #152 | Good 56.1% |
| Lumbee | 71.9 /100 | #153 | Good 55.9% |
| Ukrainians | 70.8 /100 | #154 | Good 55.8% |
| Immigrants | Venezuela | 70.7 /100 | #155 | Good 55.8% |
| Immigrants | Lithuania | 70.4 /100 | #156 | Good 55.8% |
| Immigrants | Kuwait | 70.2 /100 | #157 | Good 55.8% |
| Tlingit-Haida | 68.5 /100 | #158 | Good 55.8% |
Demographics Similar to Immigrants from Western Europe by 2 or more Vehicles in Household
In terms of 2 or more vehicles in household, the demographic groups most similar to Immigrants from Western Europe are Immigrants from Nicaragua (55.4%, a difference of 0.010%), Navajo (55.3%, a difference of 0.050%), Immigrants from Denmark (55.3%, a difference of 0.080%), Immigrants from Costa Rica (55.4%, a difference of 0.12%), and Immigrants from Cuba (55.3%, a difference of 0.17%).
| Demographics | Rating | Rank | 2 or more Vehicles in Household |
| Immigrants | Sri Lanka | 58.3 /100 | #166 | Average 55.5% |
| Kenyans | 58.1 /100 | #167 | Average 55.5% |
| French American Indians | 56.7 /100 | #168 | Average 55.5% |
| Immigrants | Austria | 56.3 /100 | #169 | Average 55.5% |
| Romanians | 55.8 /100 | #170 | Average 55.5% |
| Immigrants | Costa Rica | 54.4 /100 | #171 | Average 55.4% |
| Immigrants | Nicaragua | 51.6 /100 | #172 | Average 55.4% |
| Immigrants | Western Europe | 51.4 /100 | #173 | Average 55.4% |
| Navajo | 50.0 /100 | #174 | Average 55.3% |
| Immigrants | Denmark | 49.4 /100 | #175 | Average 55.3% |
| Immigrants | Cuba | 47.0 /100 | #176 | Average 55.3% |
| Menominee | 46.2 /100 | #177 | Average 55.3% |
| Immigrants | Sweden | 45.3 /100 | #178 | Average 55.2% |
| Alaskan Athabascans | 42.9 /100 | #179 | Average 55.2% |
| Immigrants | Kenya | 40.4 /100 | #180 | Average 55.1% |