Immigrants from Italy vs Native/Alaskan 2 or more Vehicles in Household
COMPARE
Immigrants from Italy
Native/Alaskan
2 or more Vehicles in Household
2 or more Vehicles in Household Comparison
Immigrants from Italy
Natives/Alaskans
54.4%
2 OR MORE VEHICLES IN HOUSEHOLD
15.5/ 100
METRIC RATING
201st/ 347
METRIC RANK
57.0%
2 OR MORE VEHICLES IN HOUSEHOLD
95.0/ 100
METRIC RATING
119th/ 347
METRIC RANK
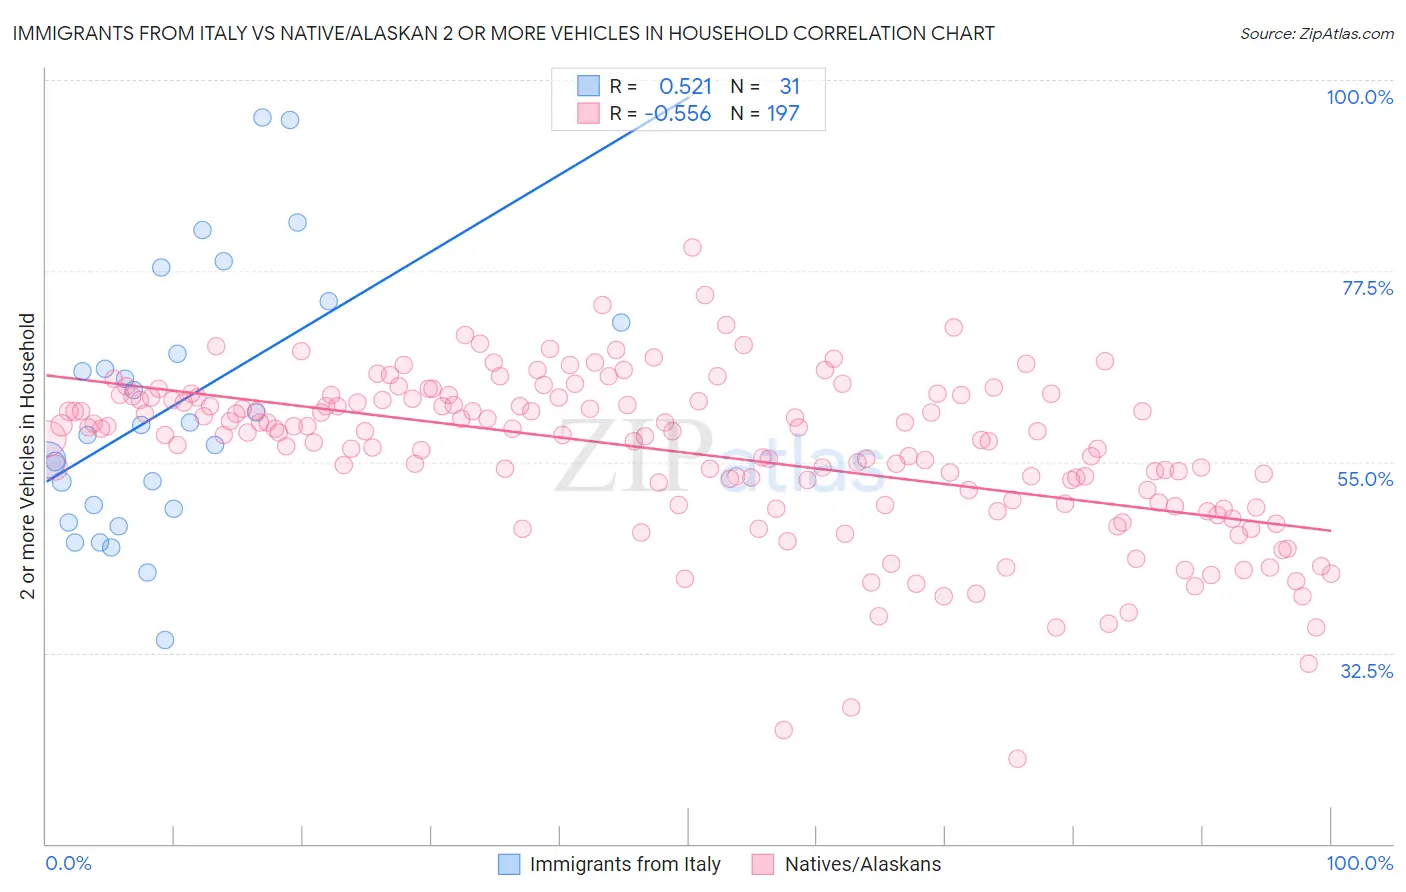
Immigrants from Italy vs Native/Alaskan 2 or more Vehicles in Household Correlation Chart
The statistical analysis conducted on geographies consisting of 324,160,818 people shows a substantial positive correlation between the proportion of Immigrants from Italy and percentage of households with 2 or more vehicles available in the United States with a correlation coefficient (R) of 0.521 and weighted average of 54.4%. Similarly, the statistical analysis conducted on geographies consisting of 512,668,217 people shows a substantial negative correlation between the proportion of Natives/Alaskans and percentage of households with 2 or more vehicles available in the United States with a correlation coefficient (R) of -0.556 and weighted average of 57.0%, a difference of 4.7%.
2 or more Vehicles in Household Correlation Summary
| Measurement | Immigrants from Italy | Native/Alaskan |
| Minimum | 34.1% | 20.0% |
| Maximum | 95.6% | 80.2% |
| Range | 61.5% | 60.2% |
| Mean | 61.4% | 56.1% |
| Median | 59.4% | 58.5% |
| Interquartile 25% (IQ1) | 49.4% | 50.1% |
| Interquartile 75% (IQ3) | 71.4% | 62.5% |
| Interquartile Range (IQR) | 22.0% | 12.4% |
| Standard Deviation (Sample) | 15.3% | 9.6% |
| Standard Deviation (Population) | 15.0% | 9.6% |
Similar Demographics by 2 or more Vehicles in Household
Demographics Similar to Immigrants from Italy by 2 or more Vehicles in Household
In terms of 2 or more vehicles in household, the demographic groups most similar to Immigrants from Italy are Immigrants from Norway (54.4%, a difference of 0.030%), Houma (54.4%, a difference of 0.030%), Immigrants from North Macedonia (54.4%, a difference of 0.050%), Carpatho Rusyn (54.4%, a difference of 0.060%), and Immigrants from Peru (54.4%, a difference of 0.090%).
| Demographics | Rating | Rank | 2 or more Vehicles in Household |
| Central Americans | 23.0 /100 | #194 | Fair 54.7% |
| Iroquois | 22.6 /100 | #195 | Fair 54.7% |
| Immigrants | Poland | 19.3 /100 | #196 | Poor 54.6% |
| Argentineans | 17.5 /100 | #197 | Poor 54.5% |
| Carpatho Rusyns | 16.2 /100 | #198 | Poor 54.4% |
| Immigrants | Norway | 15.9 /100 | #199 | Poor 54.4% |
| Houma | 15.8 /100 | #200 | Poor 54.4% |
| Immigrants | Italy | 15.5 /100 | #201 | Poor 54.4% |
| Immigrants | North Macedonia | 14.9 /100 | #202 | Poor 54.4% |
| Immigrants | Peru | 14.3 /100 | #203 | Poor 54.4% |
| Immigrants | Belgium | 13.7 /100 | #204 | Poor 54.3% |
| Cheyenne | 13.6 /100 | #205 | Poor 54.3% |
| Immigrants | Latin America | 13.1 /100 | #206 | Poor 54.3% |
| Turks | 13.0 /100 | #207 | Poor 54.3% |
| Egyptians | 12.0 /100 | #208 | Poor 54.3% |
Demographics Similar to Natives/Alaskans by 2 or more Vehicles in Household
In terms of 2 or more vehicles in household, the demographic groups most similar to Natives/Alaskans are Asian (57.0%, a difference of 0.030%), Costa Rican (56.9%, a difference of 0.050%), Iraqi (57.1%, a difference of 0.19%), Sioux (56.8%, a difference of 0.21%), and Immigrants from Jordan (57.2%, a difference of 0.38%).
| Demographics | Rating | Rank | 2 or more Vehicles in Household |
| Pueblo | 98.0 /100 | #112 | Exceptional 57.5% |
| Zimbabweans | 96.9 /100 | #113 | Exceptional 57.2% |
| Immigrants | Lebanon | 96.8 /100 | #114 | Exceptional 57.2% |
| Chippewa | 96.6 /100 | #115 | Exceptional 57.2% |
| Immigrants | Jordan | 96.6 /100 | #116 | Exceptional 57.2% |
| Iraqis | 95.8 /100 | #117 | Exceptional 57.1% |
| Asians | 95.1 /100 | #118 | Exceptional 57.0% |
| Natives/Alaskans | 95.0 /100 | #119 | Exceptional 57.0% |
| Costa Ricans | 94.7 /100 | #120 | Exceptional 56.9% |
| Sioux | 93.8 /100 | #121 | Exceptional 56.8% |
| Immigrants | South Africa | 92.5 /100 | #122 | Exceptional 56.7% |
| Australians | 91.8 /100 | #123 | Exceptional 56.7% |
| New Zealanders | 91.8 /100 | #124 | Exceptional 56.7% |
| Tsimshian | 91.6 /100 | #125 | Exceptional 56.7% |
| Estonians | 90.9 /100 | #126 | Exceptional 56.6% |