Immigrants from Italy vs Immigrants from Australia 2 or more Vehicles in Household
COMPARE
Immigrants from Italy
Immigrants from Australia
2 or more Vehicles in Household
2 or more Vehicles in Household Comparison
Immigrants from Italy
Immigrants from Australia
54.4%
2 OR MORE VEHICLES IN HOUSEHOLD
15.5/ 100
METRIC RATING
201st/ 347
METRIC RANK
52.4%
2 OR MORE VEHICLES IN HOUSEHOLD
0.5/ 100
METRIC RATING
261st/ 347
METRIC RANK
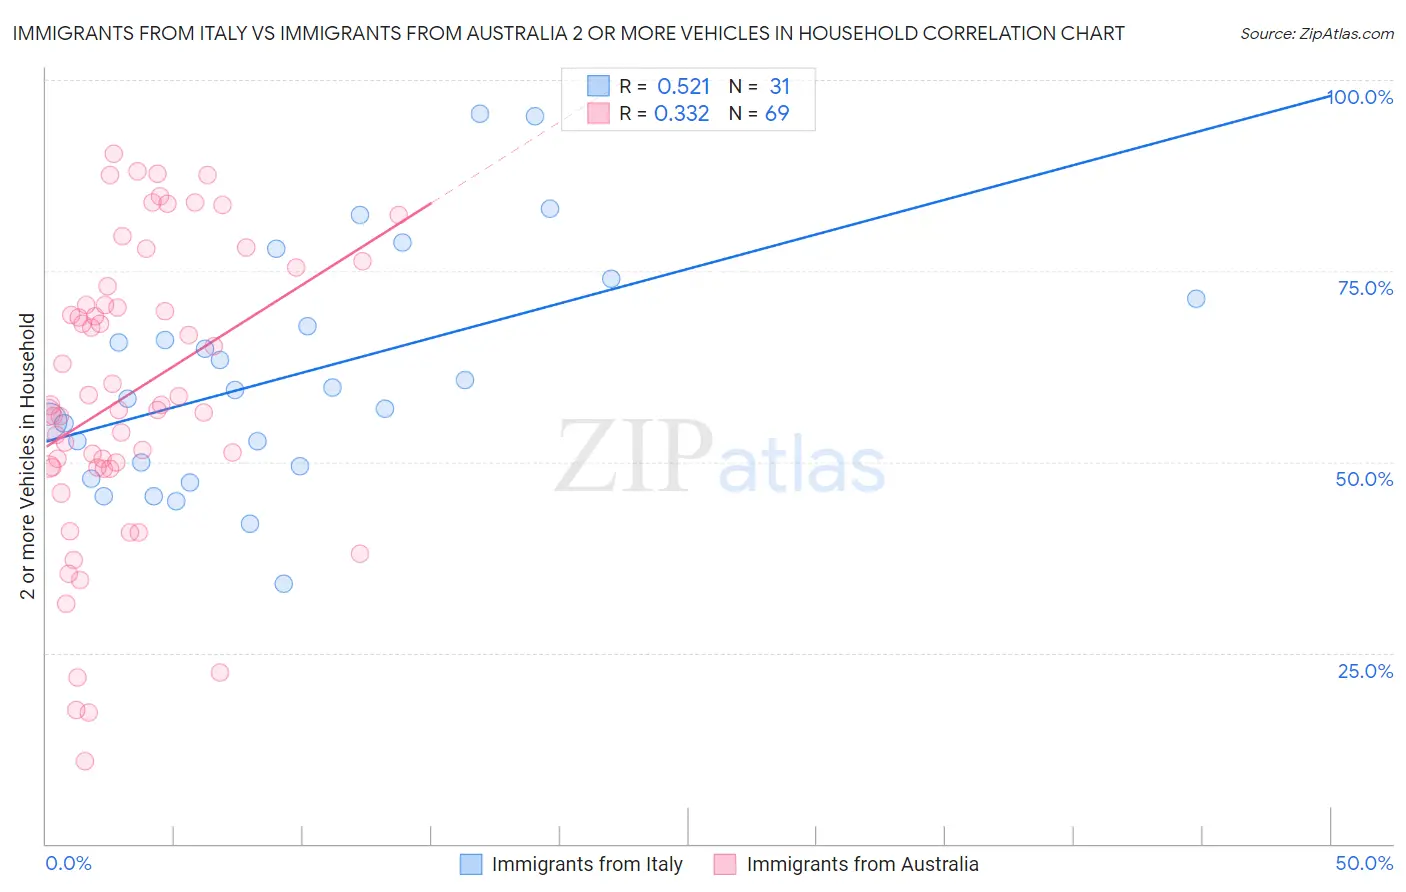
Immigrants from Italy vs Immigrants from Australia 2 or more Vehicles in Household Correlation Chart
The statistical analysis conducted on geographies consisting of 324,160,818 people shows a substantial positive correlation between the proportion of Immigrants from Italy and percentage of households with 2 or more vehicles available in the United States with a correlation coefficient (R) of 0.521 and weighted average of 54.4%. Similarly, the statistical analysis conducted on geographies consisting of 227,142,771 people shows a mild positive correlation between the proportion of Immigrants from Australia and percentage of households with 2 or more vehicles available in the United States with a correlation coefficient (R) of 0.332 and weighted average of 52.4%, a difference of 3.8%.
2 or more Vehicles in Household Correlation Summary
| Measurement | Immigrants from Italy | Immigrants from Australia |
| Minimum | 34.1% | 10.8% |
| Maximum | 95.6% | 90.4% |
| Range | 61.5% | 79.7% |
| Mean | 61.4% | 58.9% |
| Median | 59.4% | 57.4% |
| Interquartile 25% (IQ1) | 49.4% | 49.3% |
| Interquartile 75% (IQ3) | 71.4% | 71.8% |
| Interquartile Range (IQR) | 22.0% | 22.5% |
| Standard Deviation (Sample) | 15.3% | 19.0% |
| Standard Deviation (Population) | 15.0% | 18.9% |
Similar Demographics by 2 or more Vehicles in Household
Demographics Similar to Immigrants from Italy by 2 or more Vehicles in Household
In terms of 2 or more vehicles in household, the demographic groups most similar to Immigrants from Italy are Immigrants from Norway (54.4%, a difference of 0.030%), Houma (54.4%, a difference of 0.030%), Immigrants from North Macedonia (54.4%, a difference of 0.050%), Carpatho Rusyn (54.4%, a difference of 0.060%), and Immigrants from Peru (54.4%, a difference of 0.090%).
| Demographics | Rating | Rank | 2 or more Vehicles in Household |
| Central Americans | 23.0 /100 | #194 | Fair 54.7% |
| Iroquois | 22.6 /100 | #195 | Fair 54.7% |
| Immigrants | Poland | 19.3 /100 | #196 | Poor 54.6% |
| Argentineans | 17.5 /100 | #197 | Poor 54.5% |
| Carpatho Rusyns | 16.2 /100 | #198 | Poor 54.4% |
| Immigrants | Norway | 15.9 /100 | #199 | Poor 54.4% |
| Houma | 15.8 /100 | #200 | Poor 54.4% |
| Immigrants | Italy | 15.5 /100 | #201 | Poor 54.4% |
| Immigrants | North Macedonia | 14.9 /100 | #202 | Poor 54.4% |
| Immigrants | Peru | 14.3 /100 | #203 | Poor 54.4% |
| Immigrants | Belgium | 13.7 /100 | #204 | Poor 54.3% |
| Cheyenne | 13.6 /100 | #205 | Poor 54.3% |
| Immigrants | Latin America | 13.1 /100 | #206 | Poor 54.3% |
| Turks | 13.0 /100 | #207 | Poor 54.3% |
| Egyptians | 12.0 /100 | #208 | Poor 54.3% |
Demographics Similar to Immigrants from Australia by 2 or more Vehicles in Household
In terms of 2 or more vehicles in household, the demographic groups most similar to Immigrants from Australia are Immigrants from Bahamas (52.5%, a difference of 0.030%), Alsatian (52.5%, a difference of 0.10%), Central American Indian (52.5%, a difference of 0.14%), Immigrants from Northern Africa (52.3%, a difference of 0.20%), and Immigrants from Hong Kong (52.6%, a difference of 0.24%).
| Demographics | Rating | Rank | 2 or more Vehicles in Household |
| Immigrants | Malaysia | 0.8 /100 | #254 | Tragic 52.7% |
| Uruguayans | 0.7 /100 | #255 | Tragic 52.7% |
| Immigrants | Eritrea | 0.7 /100 | #256 | Tragic 52.6% |
| Immigrants | Hong Kong | 0.6 /100 | #257 | Tragic 52.6% |
| Central American Indians | 0.6 /100 | #258 | Tragic 52.5% |
| Alsatians | 0.6 /100 | #259 | Tragic 52.5% |
| Immigrants | Bahamas | 0.5 /100 | #260 | Tragic 52.5% |
| Immigrants | Australia | 0.5 /100 | #261 | Tragic 52.4% |
| Immigrants | Northern Africa | 0.4 /100 | #262 | Tragic 52.3% |
| Immigrants | Southern Europe | 0.4 /100 | #263 | Tragic 52.3% |
| Immigrants | Latvia | 0.4 /100 | #264 | Tragic 52.2% |
| Immigrants | Congo | 0.3 /100 | #265 | Tragic 52.1% |
| Immigrants | France | 0.2 /100 | #266 | Tragic 52.0% |
| Immigrants | Colombia | 0.2 /100 | #267 | Tragic 52.0% |
| Pima | 0.2 /100 | #268 | Tragic 52.0% |