Immigrants from Greece vs Creek 2 or more Vehicles in Household
COMPARE
Immigrants from Greece
Creek
2 or more Vehicles in Household
2 or more Vehicles in Household Comparison
Immigrants from Greece
Creek
50.2%
2 OR MORE VEHICLES IN HOUSEHOLD
0.0/ 100
METRIC RATING
301st/ 347
METRIC RANK
58.3%
2 OR MORE VEHICLES IN HOUSEHOLD
99.5/ 100
METRIC RATING
76th/ 347
METRIC RANK
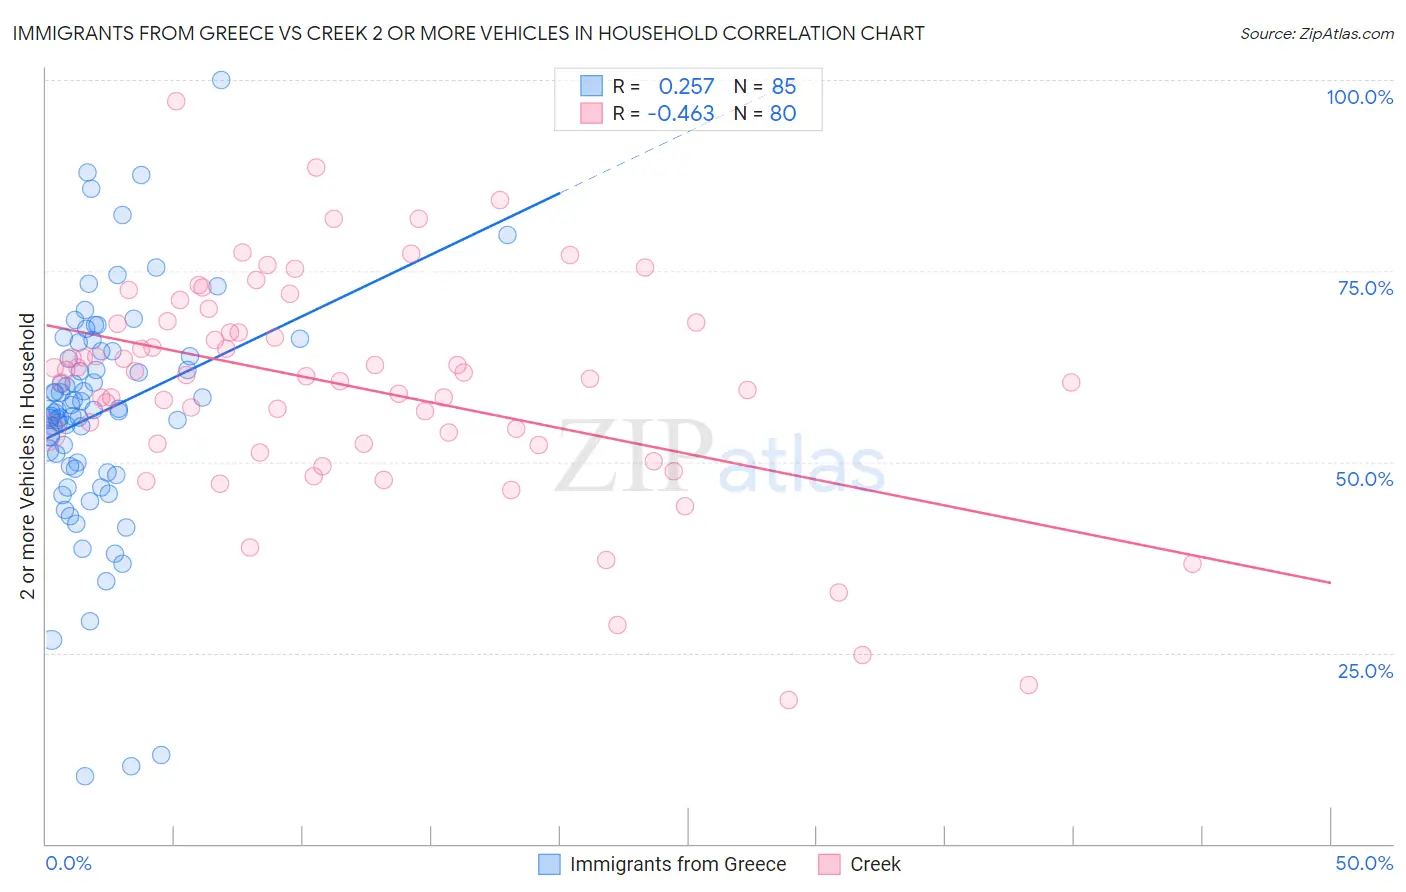
Immigrants from Greece vs Creek 2 or more Vehicles in Household Correlation Chart
The statistical analysis conducted on geographies consisting of 216,819,966 people shows a weak positive correlation between the proportion of Immigrants from Greece and percentage of households with 2 or more vehicles available in the United States with a correlation coefficient (R) of 0.257 and weighted average of 50.2%. Similarly, the statistical analysis conducted on geographies consisting of 178,443,711 people shows a moderate negative correlation between the proportion of Creek and percentage of households with 2 or more vehicles available in the United States with a correlation coefficient (R) of -0.463 and weighted average of 58.3%, a difference of 16.1%.
2 or more Vehicles in Household Correlation Summary
| Measurement | Immigrants from Greece | Creek |
| Minimum | 8.9% | 18.9% |
| Maximum | 100.0% | 97.2% |
| Range | 91.1% | 78.3% |
| Mean | 56.4% | 59.9% |
| Median | 56.7% | 61.3% |
| Interquartile 25% (IQ1) | 49.3% | 52.3% |
| Interquartile 75% (IQ3) | 64.5% | 68.2% |
| Interquartile Range (IQR) | 15.2% | 15.8% |
| Standard Deviation (Sample) | 15.5% | 14.4% |
| Standard Deviation (Population) | 15.4% | 14.4% |
Similar Demographics by 2 or more Vehicles in Household
Demographics Similar to Immigrants from Greece by 2 or more Vehicles in Household
In terms of 2 or more vehicles in household, the demographic groups most similar to Immigrants from Greece are Immigrants from South America (50.2%, a difference of 0.060%), Immigrants from Russia (50.3%, a difference of 0.18%), Immigrants from Morocco (50.3%, a difference of 0.22%), Paraguayan (50.3%, a difference of 0.25%), and Immigrants from Spain (50.4%, a difference of 0.38%).
| Demographics | Rating | Rank | 2 or more Vehicles in Household |
| Bermudans | 0.0 /100 | #294 | Tragic 50.6% |
| Cypriots | 0.0 /100 | #295 | Tragic 50.6% |
| Immigrants | Somalia | 0.0 /100 | #296 | Tragic 50.5% |
| Immigrants | Spain | 0.0 /100 | #297 | Tragic 50.4% |
| Paraguayans | 0.0 /100 | #298 | Tragic 50.3% |
| Immigrants | Morocco | 0.0 /100 | #299 | Tragic 50.3% |
| Immigrants | Russia | 0.0 /100 | #300 | Tragic 50.3% |
| Immigrants | Greece | 0.0 /100 | #301 | Tragic 50.2% |
| Immigrants | South America | 0.0 /100 | #302 | Tragic 50.2% |
| Tohono O'odham | 0.0 /100 | #303 | Tragic 50.0% |
| Immigrants | Belize | 0.0 /100 | #304 | Tragic 49.9% |
| Immigrants | Western Africa | 0.0 /100 | #305 | Tragic 49.4% |
| Immigrants | Israel | 0.0 /100 | #306 | Tragic 49.2% |
| Hopi | 0.0 /100 | #307 | Tragic 49.0% |
| Albanians | 0.0 /100 | #308 | Tragic 49.0% |
Demographics Similar to Creek by 2 or more Vehicles in Household
In terms of 2 or more vehicles in household, the demographic groups most similar to Creek are Slovene (58.3%, a difference of 0.010%), Polish (58.3%, a difference of 0.030%), Lithuanian (58.2%, a difference of 0.060%), Immigrants from Afghanistan (58.3%, a difference of 0.11%), and Bolivian (58.3%, a difference of 0.12%).
| Demographics | Rating | Rank | 2 or more Vehicles in Household |
| Pennsylvania Germans | 99.7 /100 | #69 | Exceptional 58.5% |
| Italians | 99.6 /100 | #70 | Exceptional 58.4% |
| Bangladeshis | 99.6 /100 | #71 | Exceptional 58.4% |
| Austrians | 99.6 /100 | #72 | Exceptional 58.4% |
| Bolivians | 99.6 /100 | #73 | Exceptional 58.3% |
| Immigrants | Afghanistan | 99.6 /100 | #74 | Exceptional 58.3% |
| Poles | 99.5 /100 | #75 | Exceptional 58.3% |
| Creek | 99.5 /100 | #76 | Exceptional 58.3% |
| Slovenes | 99.5 /100 | #77 | Exceptional 58.3% |
| Lithuanians | 99.5 /100 | #78 | Exceptional 58.2% |
| Delaware | 99.4 /100 | #79 | Exceptional 58.2% |
| Immigrants | England | 99.3 /100 | #80 | Exceptional 58.1% |
| Immigrants | Iraq | 99.3 /100 | #81 | Exceptional 58.1% |
| Iranians | 99.3 /100 | #82 | Exceptional 58.1% |
| Icelanders | 99.2 /100 | #83 | Exceptional 58.0% |