Immigrants from Croatia Disability Age Under 5
COMPARE
Immigrants from Croatia
Select to Compare
Disability Age Under 5
Immigrants from Croatia Disability Age Under 5
1.3%
DISABILITY | AGE UNDER 5
11.2/ 100
METRIC RATING
219th/ 347
METRIC RANK
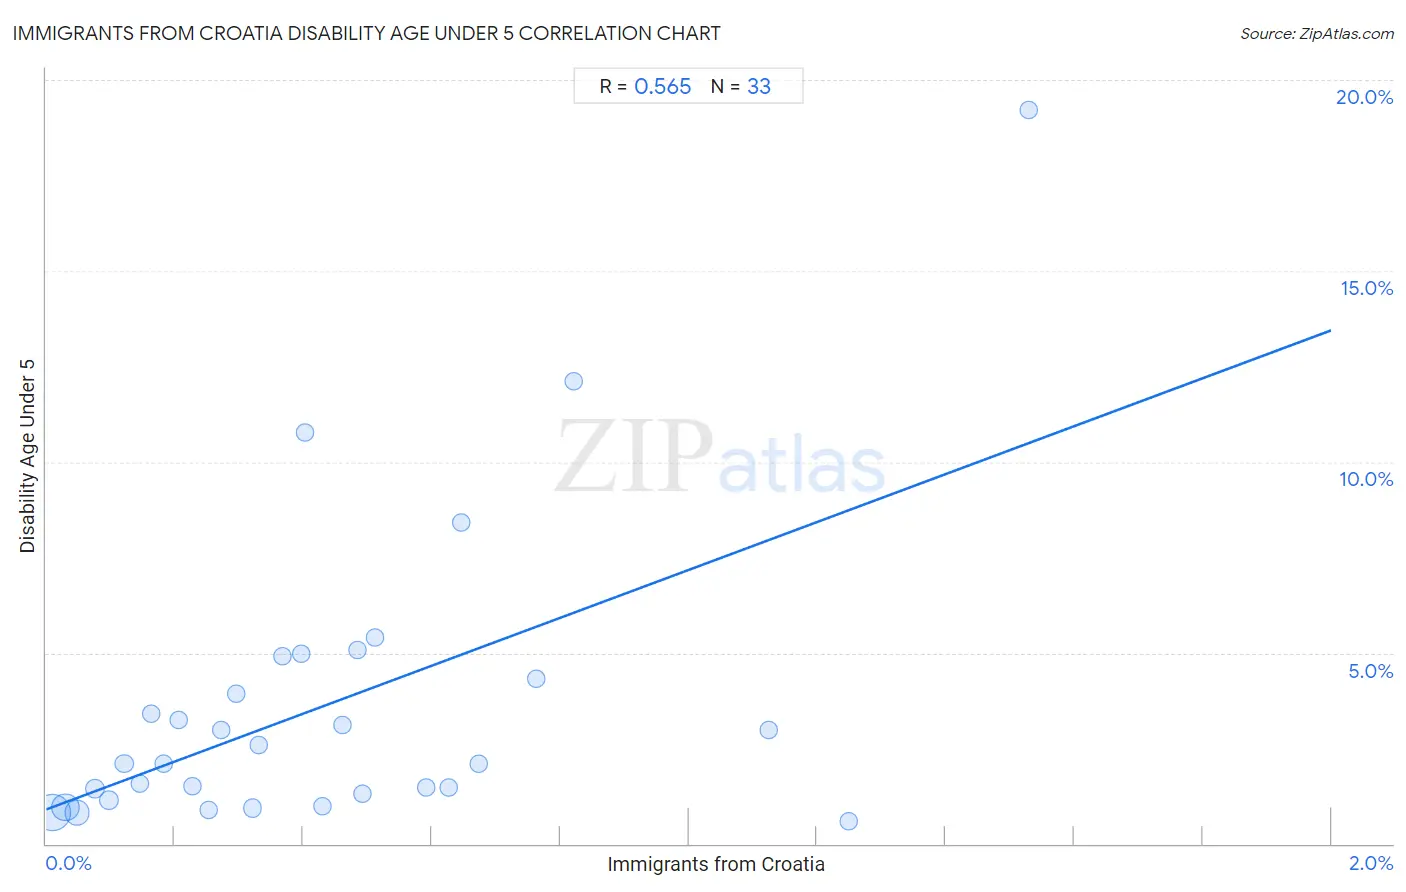
Immigrants from Croatia Disability Age Under 5 Correlation Chart
The statistical analysis conducted on geographies consisting of 91,296,638 people shows a substantial positive correlation between the proportion of Immigrants from Croatia and percentage of population with a disability under the age of 5 in the United States with a correlation coefficient (R) of 0.565 and weighted average of 1.3%. On average, for every 1% (one percent) increase in Immigrants from Croatia within a typical geography, there is an increase of 6.3% in percentage of population with a disability under the age of 5.
It is essential to understand that the correlation between the percentage of Immigrants from Croatia and percentage of population with a disability under the age of 5 does not imply a direct cause-and-effect relationship. It remains uncertain whether the presence of Immigrants from Croatia influences an upward or downward trend in the level of percentage of population with a disability under the age of 5 within an area, or if Immigrants from Croatia simply ended up residing in those areas with higher or lower levels of percentage of population with a disability under the age of 5 due to other factors.
Demographics Similar to Immigrants from Croatia by Disability Age Under 5
In terms of disability age under 5, the demographic groups most similar to Immigrants from Croatia are Serbian (1.3%, a difference of 0.37%), Malaysian (1.3%, a difference of 0.40%), Subsaharan African (1.3%, a difference of 0.71%), Ukrainian (1.3%, a difference of 0.71%), and Cypriot (1.3%, a difference of 0.72%).
| Demographics | Rating | Rank | Disability Age Under 5 |
| Chileans | 18.8 /100 | #212 | Poor 1.3% |
| Immigrants from Sudan | 18.7 /100 | #213 | Poor 1.3% |
| Immigrants from Chile | 17.2 /100 | #214 | Poor 1.3% |
| Syrians | 16.1 /100 | #215 | Poor 1.3% |
| Bangladeshis | 15.5 /100 | #216 | Poor 1.3% |
| Cypriots | 14.9 /100 | #217 | Poor 1.3% |
| Malaysians | 13.2 /100 | #218 | Poor 1.3% |
| Immigrants from Croatia | 11.2 /100 | #219 | Poor 1.3% |
| Serbians | 9.6 /100 | #220 | Tragic 1.3% |
| Sub-Saharan Africans | 8.3 /100 | #221 | Tragic 1.3% |
| Ukrainians | 8.3 /100 | #222 | Tragic 1.3% |
| Hispanics or Latinos | 7.7 /100 | #223 | Tragic 1.3% |
| Latvians | 7.1 /100 | #224 | Tragic 1.3% |
| Panamanians | 7.1 /100 | #225 | Tragic 1.3% |
| Bahamians | 7.1 /100 | #226 | Tragic 1.3% |
Immigrants from Croatia Disability Age Under 5 Correlation Summary
| Measurement | Immigrants from Croatia Data | Disability Age Under 5 Data |
| Minimum | 0.0094% | 0.59% |
| Maximum | 1.5% | 19.2% |
| Range | 1.5% | 18.6% |
| Mean | 0.43% | 3.6% |
| Median | 0.37% | 2.1% |
| Interquartile 25% (IQ1) | 0.17% | 1.2% |
| Interquartile 75% (IQ3) | 0.61% | 4.6% |
| Interquartile Range (IQR) | 0.44% | 3.4% |
| Standard Deviation (Sample) | 0.35% | 3.9% |
| Standard Deviation (Population) | 0.35% | 3.9% |
Correlation Details
| Immigrants from Croatia Percentile | Sample Size | Disability Age Under 5 |
[ 0.0% - 0.5% ] 0.0094% | 44,125,050 | 0.81% |
[ 0.0% - 0.5% ] 0.030% | 21,583,663 | 0.96% |
[ 0.0% - 0.5% ] 0.048% | 16,783,129 | 0.81% |
[ 0.0% - 0.5% ] 0.077% | 3,180,503 | 1.4% |
[ 0.0% - 0.5% ] 0.098% | 2,202,309 | 1.1% |
[ 0.0% - 0.5% ] 0.12% | 737,295 | 2.1% |
[ 0.0% - 0.5% ] 0.14% | 587,753 | 1.6% |
[ 0.0% - 0.5% ] 0.16% | 306,084 | 3.4% |
[ 0.0% - 0.5% ] 0.18% | 315,307 | 2.1% |
[ 0.0% - 0.5% ] 0.21% | 221,789 | 3.2% |
[ 0.0% - 0.5% ] 0.23% | 164,546 | 1.5% |
[ 0.0% - 0.5% ] 0.25% | 218,821 | 0.89% |
[ 0.0% - 0.5% ] 0.27% | 146,798 | 3.0% |
[ 0.0% - 0.5% ] 0.30% | 120,197 | 3.9% |
[ 0.0% - 0.5% ] 0.32% | 82,482 | 0.93% |
[ 0.0% - 0.5% ] 0.33% | 73,329 | 2.6% |
[ 0.0% - 0.5% ] 0.37% | 1,632 | 4.9% |
[ 0.0% - 0.5% ] 0.40% | 25,699 | 5.0% |
[ 0.0% - 0.5% ] 0.40% | 8,208 | 10.8% |
[ 0.0% - 0.5% ] 0.43% | 93,959 | 0.98% |
[ 0.0% - 0.5% ] 0.46% | 7,152 | 3.1% |
[ 0.0% - 0.5% ] 0.48% | 7,641 | 5.1% |
[ 0.0% - 0.5% ] 0.49% | 95,874 | 1.3% |
[ 0.5% - 1.0% ] 0.51% | 8,194 | 5.4% |
[ 0.5% - 1.0% ] 0.59% | 63,431 | 1.5% |
[ 0.5% - 1.0% ] 0.63% | 53,028 | 1.5% |
[ 0.5% - 1.0% ] 0.65% | 18,705 | 8.4% |
[ 0.5% - 1.0% ] 0.67% | 8,471 | 2.1% |
[ 0.5% - 1.0% ] 0.76% | 1,838 | 4.3% |
[ 0.5% - 1.0% ] 0.82% | 10,731 | 12.1% |
[ 1.0% - 1.5% ] 1.13% | 3,999 | 3.0% |
[ 1.0% - 1.5% ] 1.25% | 37,647 | 0.59% |
[ 1.5% - 2.0% ] 1.53% | 1,374 | 19.2% |