Immigrants from Croatia vs Immigrants from Australia 2 or more Vehicles in Household
COMPARE
Immigrants from Croatia
Immigrants from Australia
2 or more Vehicles in Household
2 or more Vehicles in Household Comparison
Immigrants from Croatia
Immigrants from Australia
51.8%
2 OR MORE VEHICLES IN HOUSEHOLD
0.2/ 100
METRIC RATING
276th/ 347
METRIC RANK
52.4%
2 OR MORE VEHICLES IN HOUSEHOLD
0.5/ 100
METRIC RATING
261st/ 347
METRIC RANK
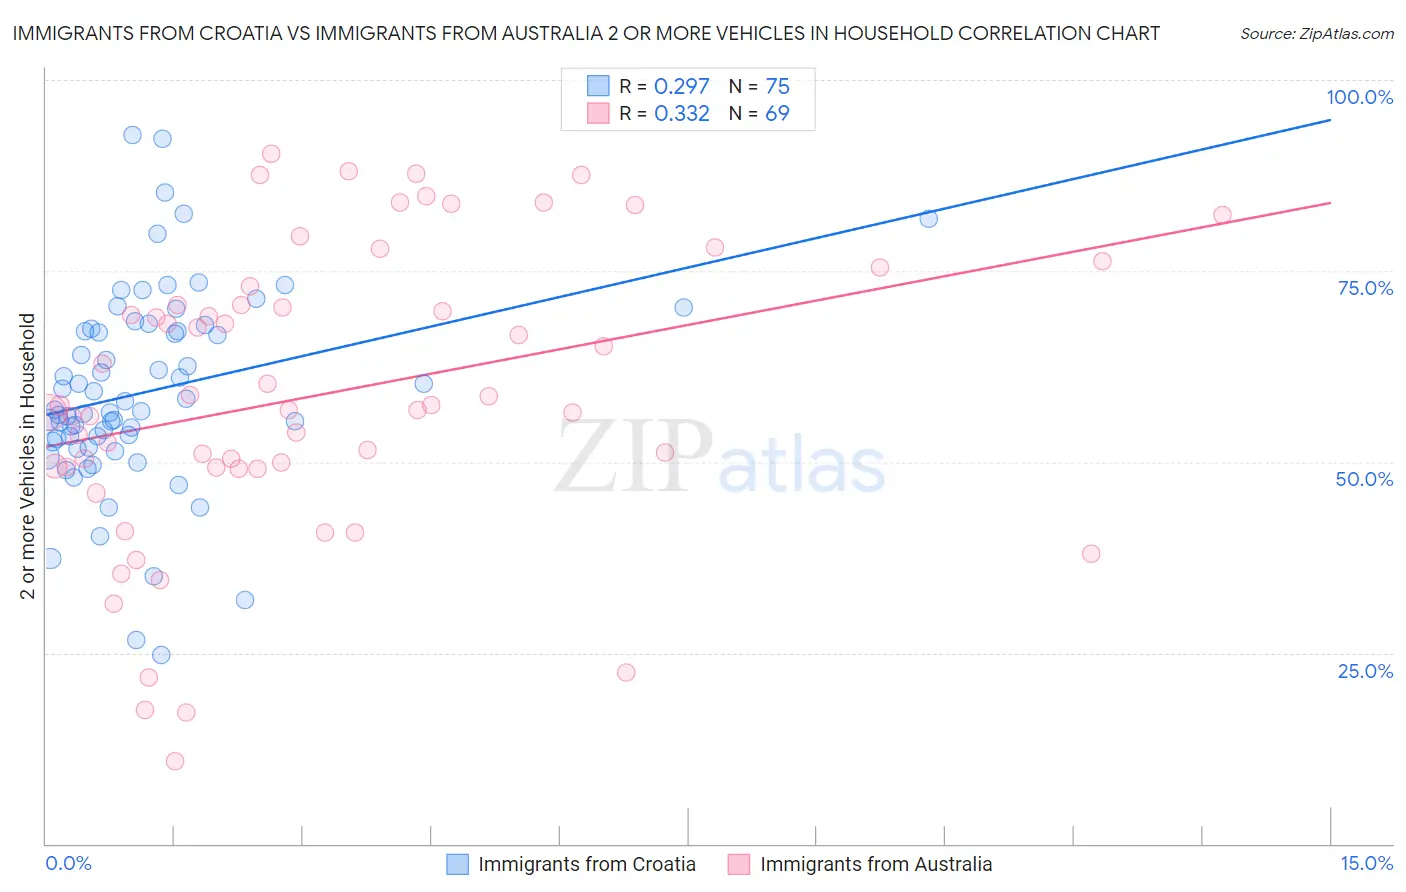
Immigrants from Croatia vs Immigrants from Australia 2 or more Vehicles in Household Correlation Chart
The statistical analysis conducted on geographies consisting of 132,533,947 people shows a weak positive correlation between the proportion of Immigrants from Croatia and percentage of households with 2 or more vehicles available in the United States with a correlation coefficient (R) of 0.297 and weighted average of 51.8%. Similarly, the statistical analysis conducted on geographies consisting of 227,142,771 people shows a mild positive correlation between the proportion of Immigrants from Australia and percentage of households with 2 or more vehicles available in the United States with a correlation coefficient (R) of 0.332 and weighted average of 52.4%, a difference of 1.2%.
2 or more Vehicles in Household Correlation Summary
| Measurement | Immigrants from Croatia | Immigrants from Australia |
| Minimum | 24.7% | 10.8% |
| Maximum | 92.9% | 90.4% |
| Range | 68.1% | 79.7% |
| Mean | 59.2% | 58.9% |
| Median | 56.8% | 57.4% |
| Interquartile 25% (IQ1) | 52.6% | 49.3% |
| Interquartile 75% (IQ3) | 67.5% | 71.8% |
| Interquartile Range (IQR) | 14.8% | 22.5% |
| Standard Deviation (Sample) | 13.1% | 19.0% |
| Standard Deviation (Population) | 13.0% | 18.9% |
Demographics Similar to Immigrants from Croatia and Immigrants from Australia by 2 or more Vehicles in Household
In terms of 2 or more vehicles in household, the demographic groups most similar to Immigrants from Croatia are Immigrants from Honduras (51.8%, a difference of 0.030%), African (51.8%, a difference of 0.040%), Immigrants from Africa (51.8%, a difference of 0.050%), Israeli (51.9%, a difference of 0.090%), and Yuman (51.7%, a difference of 0.12%). Similarly, the demographic groups most similar to Immigrants from Australia are Immigrants from Bahamas (52.5%, a difference of 0.030%), Alsatian (52.5%, a difference of 0.10%), Central American Indian (52.5%, a difference of 0.14%), Immigrants from Northern Africa (52.3%, a difference of 0.20%), and Immigrants from Southern Europe (52.3%, a difference of 0.33%).
| Demographics | Rating | Rank | 2 or more Vehicles in Household |
| Central American Indians | 0.6 /100 | #258 | Tragic 52.5% |
| Alsatians | 0.6 /100 | #259 | Tragic 52.5% |
| Immigrants | Bahamas | 0.5 /100 | #260 | Tragic 52.5% |
| Immigrants | Australia | 0.5 /100 | #261 | Tragic 52.4% |
| Immigrants | Northern Africa | 0.4 /100 | #262 | Tragic 52.3% |
| Immigrants | Southern Europe | 0.4 /100 | #263 | Tragic 52.3% |
| Immigrants | Latvia | 0.4 /100 | #264 | Tragic 52.2% |
| Immigrants | Congo | 0.3 /100 | #265 | Tragic 52.1% |
| Immigrants | France | 0.2 /100 | #266 | Tragic 52.0% |
| Immigrants | Colombia | 0.2 /100 | #267 | Tragic 52.0% |
| Pima | 0.2 /100 | #268 | Tragic 52.0% |
| Hondurans | 0.2 /100 | #269 | Tragic 52.0% |
| Immigrants | Ireland | 0.2 /100 | #270 | Tragic 52.0% |
| South Americans | 0.2 /100 | #271 | Tragic 51.9% |
| Sub-Saharan Africans | 0.2 /100 | #272 | Tragic 51.9% |
| Israelis | 0.2 /100 | #273 | Tragic 51.9% |
| Africans | 0.2 /100 | #274 | Tragic 51.8% |
| Immigrants | Honduras | 0.2 /100 | #275 | Tragic 51.8% |
| Immigrants | Croatia | 0.2 /100 | #276 | Tragic 51.8% |
| Immigrants | Africa | 0.2 /100 | #277 | Tragic 51.8% |
| Yuman | 0.1 /100 | #278 | Tragic 51.7% |