Immigrants from Bulgaria vs Immigrants from Scotland 2 or more Vehicles in Household
COMPARE
Immigrants from Bulgaria
Immigrants from Scotland
2 or more Vehicles in Household
2 or more Vehicles in Household Comparison
Immigrants from Bulgaria
Immigrants from Scotland
54.3%
2 OR MORE VEHICLES IN HOUSEHOLD
12.0/ 100
METRIC RATING
209th/ 347
METRIC RANK
58.9%
2 OR MORE VEHICLES IN HOUSEHOLD
99.8/ 100
METRIC RATING
58th/ 347
METRIC RANK
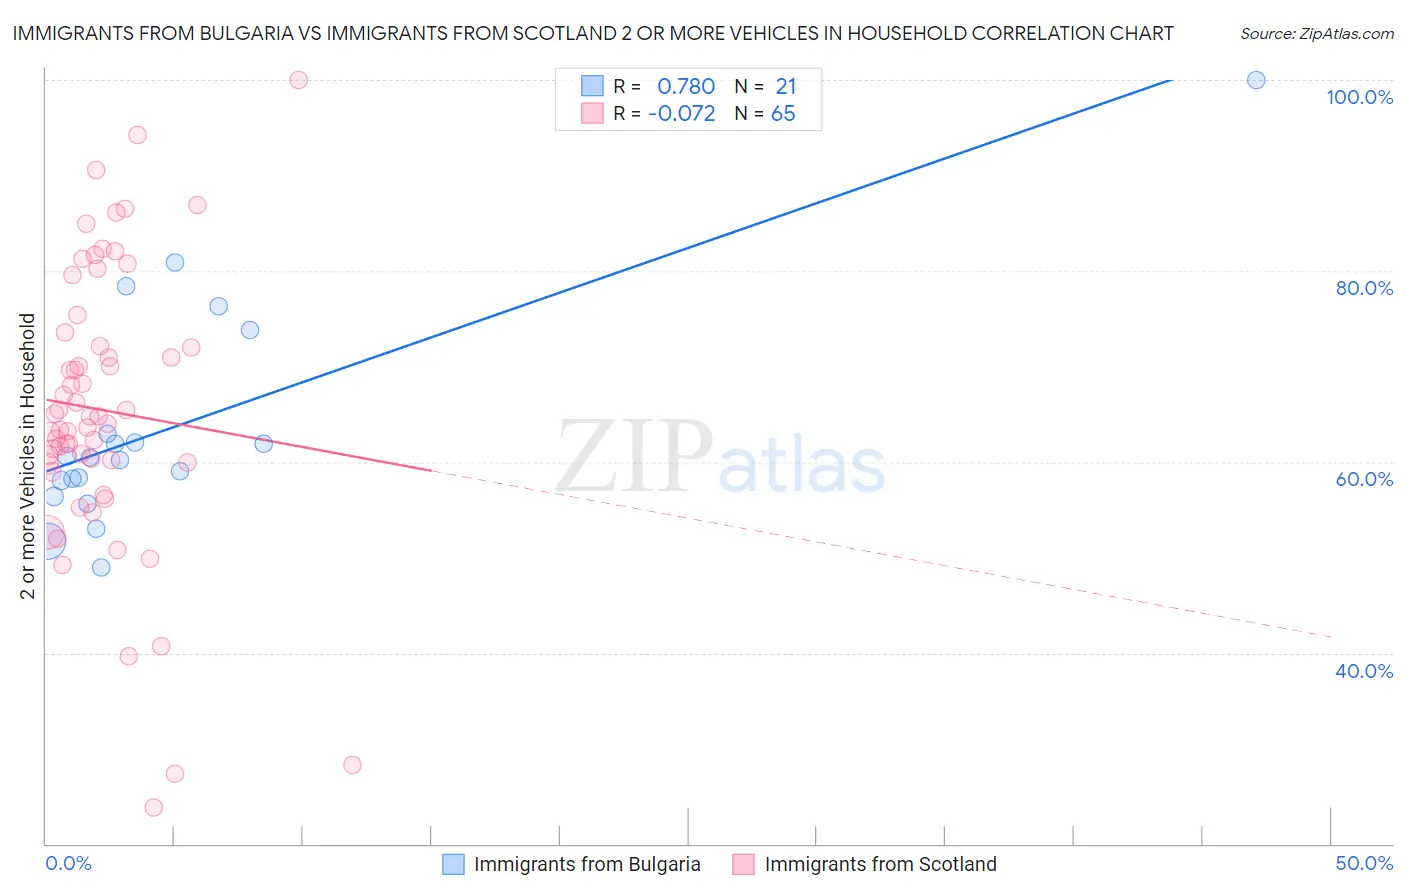
Immigrants from Bulgaria vs Immigrants from Scotland 2 or more Vehicles in Household Correlation Chart
The statistical analysis conducted on geographies consisting of 172,541,029 people shows a strong positive correlation between the proportion of Immigrants from Bulgaria and percentage of households with 2 or more vehicles available in the United States with a correlation coefficient (R) of 0.780 and weighted average of 54.3%. Similarly, the statistical analysis conducted on geographies consisting of 196,383,501 people shows a slight negative correlation between the proportion of Immigrants from Scotland and percentage of households with 2 or more vehicles available in the United States with a correlation coefficient (R) of -0.072 and weighted average of 58.9%, a difference of 8.6%.
2 or more Vehicles in Household Correlation Summary
| Measurement | Immigrants from Bulgaria | Immigrants from Scotland |
| Minimum | 49.0% | 23.8% |
| Maximum | 100.0% | 100.0% |
| Range | 51.0% | 76.2% |
| Mean | 63.7% | 65.4% |
| Median | 60.5% | 64.8% |
| Interquartile 25% (IQ1) | 57.2% | 59.9% |
| Interquartile 75% (IQ3) | 68.3% | 72.8% |
| Interquartile Range (IQR) | 11.1% | 13.0% |
| Standard Deviation (Sample) | 11.9% | 14.8% |
| Standard Deviation (Population) | 11.6% | 14.7% |
Similar Demographics by 2 or more Vehicles in Household
Demographics Similar to Immigrants from Bulgaria by 2 or more Vehicles in Household
In terms of 2 or more vehicles in household, the demographic groups most similar to Immigrants from Bulgaria are Egyptian (54.3%, a difference of 0.0%), Immigrants from Saudi Arabia (54.2%, a difference of 0.060%), Immigrants from Hungary (54.2%, a difference of 0.070%), Turkish (54.3%, a difference of 0.090%), and Immigrants from Chile (54.2%, a difference of 0.090%).
| Demographics | Rating | Rank | 2 or more Vehicles in Household |
| Immigrants | North Macedonia | 14.9 /100 | #202 | Poor 54.4% |
| Immigrants | Peru | 14.3 /100 | #203 | Poor 54.4% |
| Immigrants | Belgium | 13.7 /100 | #204 | Poor 54.3% |
| Cheyenne | 13.6 /100 | #205 | Poor 54.3% |
| Immigrants | Latin America | 13.1 /100 | #206 | Poor 54.3% |
| Turks | 13.0 /100 | #207 | Poor 54.3% |
| Egyptians | 12.0 /100 | #208 | Poor 54.3% |
| Immigrants | Bulgaria | 12.0 /100 | #209 | Poor 54.3% |
| Immigrants | Saudi Arabia | 11.3 /100 | #210 | Poor 54.2% |
| Immigrants | Hungary | 11.3 /100 | #211 | Poor 54.2% |
| Immigrants | Chile | 11.1 /100 | #212 | Poor 54.2% |
| Guatemalans | 9.6 /100 | #213 | Tragic 54.1% |
| Immigrants | Czechoslovakia | 9.4 /100 | #214 | Tragic 54.1% |
| Aleuts | 9.3 /100 | #215 | Tragic 54.1% |
| Immigrants | Western Asia | 9.3 /100 | #216 | Tragic 54.1% |
Demographics Similar to Immigrants from Scotland by 2 or more Vehicles in Household
In terms of 2 or more vehicles in household, the demographic groups most similar to Immigrants from Scotland are Spanish American (58.9%, a difference of 0.020%), French Canadian (58.9%, a difference of 0.050%), Afghan (59.0%, a difference of 0.18%), Osage (58.8%, a difference of 0.18%), and Chickasaw (59.0%, a difference of 0.19%).
| Demographics | Rating | Rank | 2 or more Vehicles in Household |
| Spaniards | 99.9 /100 | #51 | Exceptional 59.2% |
| Immigrants | Laos | 99.9 /100 | #52 | Exceptional 59.2% |
| Celtics | 99.9 /100 | #53 | Exceptional 59.2% |
| Bhutanese | 99.9 /100 | #54 | Exceptional 59.1% |
| Luxembourgers | 99.9 /100 | #55 | Exceptional 59.1% |
| Chickasaw | 99.9 /100 | #56 | Exceptional 59.0% |
| Afghans | 99.9 /100 | #57 | Exceptional 59.0% |
| Immigrants | Scotland | 99.8 /100 | #58 | Exceptional 58.9% |
| Spanish Americans | 99.8 /100 | #59 | Exceptional 58.9% |
| French Canadians | 99.8 /100 | #60 | Exceptional 58.9% |
| Osage | 99.8 /100 | #61 | Exceptional 58.8% |
| Immigrants | Nonimmigrants | 99.8 /100 | #62 | Exceptional 58.8% |
| Mexican American Indians | 99.8 /100 | #63 | Exceptional 58.7% |
| Portuguese | 99.7 /100 | #64 | Exceptional 58.6% |
| Immigrants | Central America | 99.7 /100 | #65 | Exceptional 58.6% |