Immigrants from Bulgaria vs Immigrants from Congo 2 or more Vehicles in Household
COMPARE
Immigrants from Bulgaria
Immigrants from Congo
2 or more Vehicles in Household
2 or more Vehicles in Household Comparison
Immigrants from Bulgaria
Immigrants from Congo
54.3%
2 OR MORE VEHICLES IN HOUSEHOLD
12.0/ 100
METRIC RATING
209th/ 347
METRIC RANK
52.1%
2 OR MORE VEHICLES IN HOUSEHOLD
0.3/ 100
METRIC RATING
265th/ 347
METRIC RANK
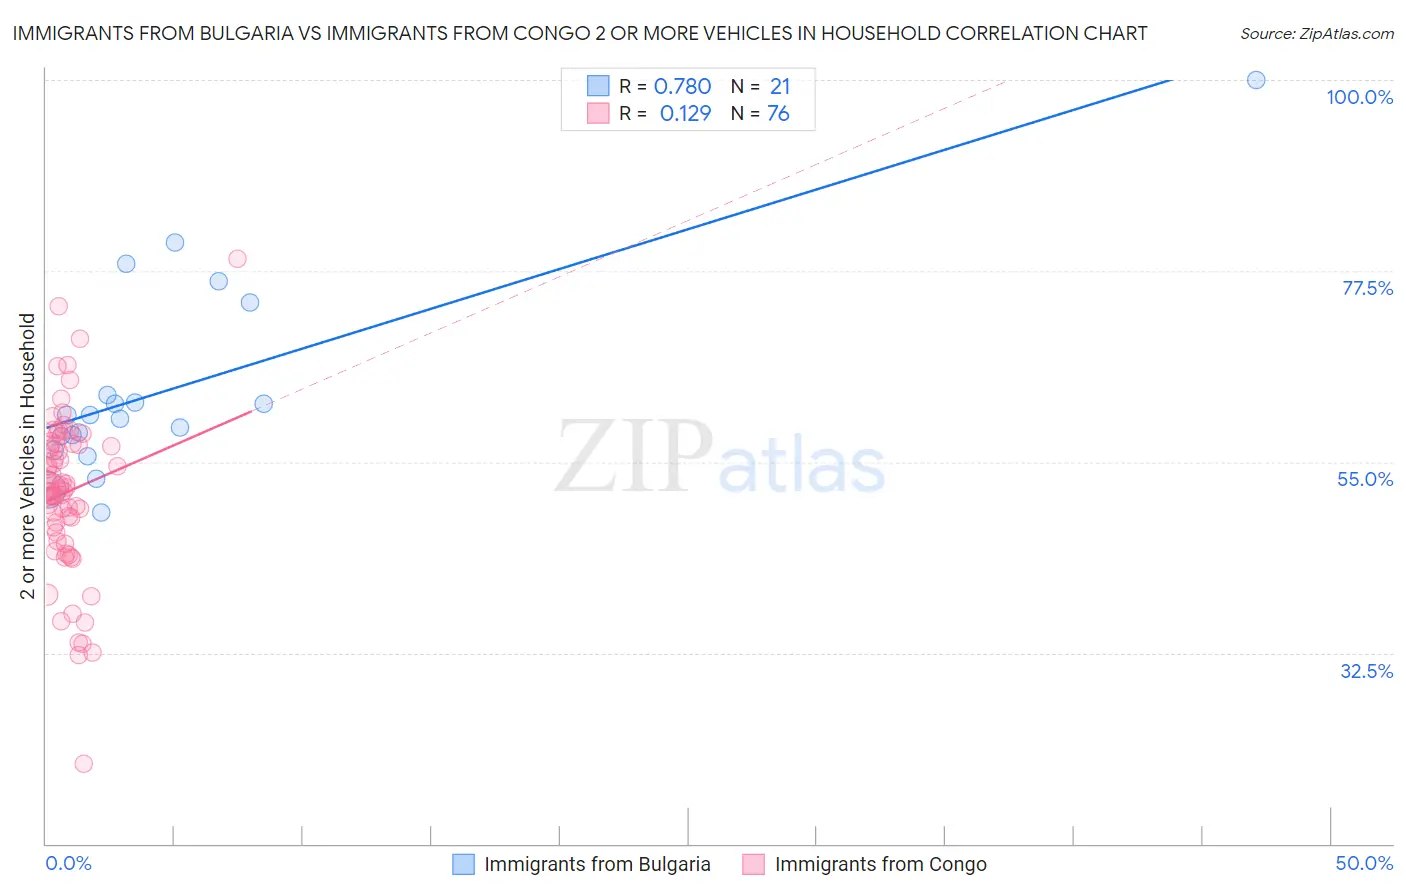
Immigrants from Bulgaria vs Immigrants from Congo 2 or more Vehicles in Household Correlation Chart
The statistical analysis conducted on geographies consisting of 172,541,029 people shows a strong positive correlation between the proportion of Immigrants from Bulgaria and percentage of households with 2 or more vehicles available in the United States with a correlation coefficient (R) of 0.780 and weighted average of 54.3%. Similarly, the statistical analysis conducted on geographies consisting of 92,104,745 people shows a poor positive correlation between the proportion of Immigrants from Congo and percentage of households with 2 or more vehicles available in the United States with a correlation coefficient (R) of 0.129 and weighted average of 52.1%, a difference of 4.1%.
2 or more Vehicles in Household Correlation Summary
| Measurement | Immigrants from Bulgaria | Immigrants from Congo |
| Minimum | 49.0% | 19.4% |
| Maximum | 100.0% | 79.0% |
| Range | 51.0% | 59.6% |
| Mean | 63.7% | 51.4% |
| Median | 60.5% | 51.7% |
| Interquartile 25% (IQ1) | 57.2% | 47.0% |
| Interquartile 75% (IQ3) | 68.3% | 57.1% |
| Interquartile Range (IQR) | 11.1% | 10.1% |
| Standard Deviation (Sample) | 11.9% | 9.7% |
| Standard Deviation (Population) | 11.6% | 9.6% |
Similar Demographics by 2 or more Vehicles in Household
Demographics Similar to Immigrants from Bulgaria by 2 or more Vehicles in Household
In terms of 2 or more vehicles in household, the demographic groups most similar to Immigrants from Bulgaria are Egyptian (54.3%, a difference of 0.0%), Immigrants from Saudi Arabia (54.2%, a difference of 0.060%), Immigrants from Hungary (54.2%, a difference of 0.070%), Turkish (54.3%, a difference of 0.090%), and Immigrants from Chile (54.2%, a difference of 0.090%).
| Demographics | Rating | Rank | 2 or more Vehicles in Household |
| Immigrants | North Macedonia | 14.9 /100 | #202 | Poor 54.4% |
| Immigrants | Peru | 14.3 /100 | #203 | Poor 54.4% |
| Immigrants | Belgium | 13.7 /100 | #204 | Poor 54.3% |
| Cheyenne | 13.6 /100 | #205 | Poor 54.3% |
| Immigrants | Latin America | 13.1 /100 | #206 | Poor 54.3% |
| Turks | 13.0 /100 | #207 | Poor 54.3% |
| Egyptians | 12.0 /100 | #208 | Poor 54.3% |
| Immigrants | Bulgaria | 12.0 /100 | #209 | Poor 54.3% |
| Immigrants | Saudi Arabia | 11.3 /100 | #210 | Poor 54.2% |
| Immigrants | Hungary | 11.3 /100 | #211 | Poor 54.2% |
| Immigrants | Chile | 11.1 /100 | #212 | Poor 54.2% |
| Guatemalans | 9.6 /100 | #213 | Tragic 54.1% |
| Immigrants | Czechoslovakia | 9.4 /100 | #214 | Tragic 54.1% |
| Aleuts | 9.3 /100 | #215 | Tragic 54.1% |
| Immigrants | Western Asia | 9.3 /100 | #216 | Tragic 54.1% |
Demographics Similar to Immigrants from Congo by 2 or more Vehicles in Household
In terms of 2 or more vehicles in household, the demographic groups most similar to Immigrants from Congo are Immigrants from France (52.0%, a difference of 0.14%), Immigrants from Colombia (52.0%, a difference of 0.19%), Pima (52.0%, a difference of 0.20%), Honduran (52.0%, a difference of 0.20%), and Immigrants from Ireland (52.0%, a difference of 0.22%).
| Demographics | Rating | Rank | 2 or more Vehicles in Household |
| Central American Indians | 0.6 /100 | #258 | Tragic 52.5% |
| Alsatians | 0.6 /100 | #259 | Tragic 52.5% |
| Immigrants | Bahamas | 0.5 /100 | #260 | Tragic 52.5% |
| Immigrants | Australia | 0.5 /100 | #261 | Tragic 52.4% |
| Immigrants | Northern Africa | 0.4 /100 | #262 | Tragic 52.3% |
| Immigrants | Southern Europe | 0.4 /100 | #263 | Tragic 52.3% |
| Immigrants | Latvia | 0.4 /100 | #264 | Tragic 52.2% |
| Immigrants | Congo | 0.3 /100 | #265 | Tragic 52.1% |
| Immigrants | France | 0.2 /100 | #266 | Tragic 52.0% |
| Immigrants | Colombia | 0.2 /100 | #267 | Tragic 52.0% |
| Pima | 0.2 /100 | #268 | Tragic 52.0% |
| Hondurans | 0.2 /100 | #269 | Tragic 52.0% |
| Immigrants | Ireland | 0.2 /100 | #270 | Tragic 52.0% |
| South Americans | 0.2 /100 | #271 | Tragic 51.9% |
| Sub-Saharan Africans | 0.2 /100 | #272 | Tragic 51.9% |