Immigrants from Bulgaria vs Immigrants from Singapore 2 or more Vehicles in Household
COMPARE
Immigrants from Bulgaria
Immigrants from Singapore
2 or more Vehicles in Household
2 or more Vehicles in Household Comparison
Immigrants from Bulgaria
Immigrants from Singapore
54.3%
2 OR MORE VEHICLES IN HOUSEHOLD
12.0/ 100
METRIC RATING
209th/ 347
METRIC RANK
53.9%
2 OR MORE VEHICLES IN HOUSEHOLD
6.3/ 100
METRIC RATING
221st/ 347
METRIC RANK
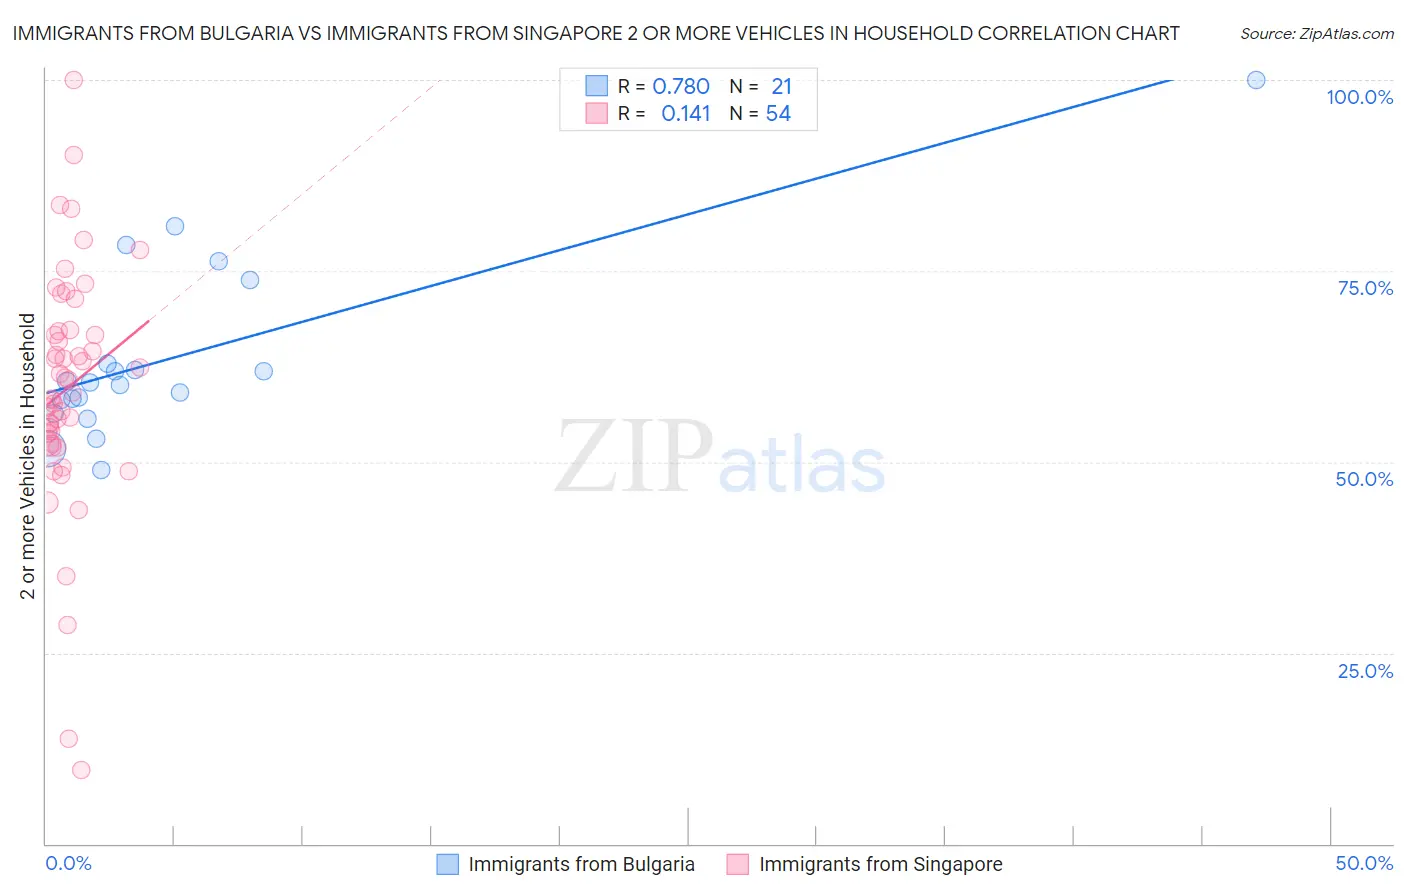
Immigrants from Bulgaria vs Immigrants from Singapore 2 or more Vehicles in Household Correlation Chart
The statistical analysis conducted on geographies consisting of 172,541,029 people shows a strong positive correlation between the proportion of Immigrants from Bulgaria and percentage of households with 2 or more vehicles available in the United States with a correlation coefficient (R) of 0.780 and weighted average of 54.3%. Similarly, the statistical analysis conducted on geographies consisting of 137,464,640 people shows a poor positive correlation between the proportion of Immigrants from Singapore and percentage of households with 2 or more vehicles available in the United States with a correlation coefficient (R) of 0.141 and weighted average of 53.9%, a difference of 0.73%.
2 or more Vehicles in Household Correlation Summary
| Measurement | Immigrants from Bulgaria | Immigrants from Singapore |
| Minimum | 49.0% | 9.7% |
| Maximum | 100.0% | 100.0% |
| Range | 51.0% | 90.3% |
| Mean | 63.7% | 59.7% |
| Median | 60.5% | 59.9% |
| Interquartile 25% (IQ1) | 57.2% | 52.4% |
| Interquartile 75% (IQ3) | 68.3% | 67.1% |
| Interquartile Range (IQR) | 11.1% | 14.6% |
| Standard Deviation (Sample) | 11.9% | 15.9% |
| Standard Deviation (Population) | 11.6% | 15.7% |
Demographics Similar to Immigrants from Bulgaria and Immigrants from Singapore by 2 or more Vehicles in Household
In terms of 2 or more vehicles in household, the demographic groups most similar to Immigrants from Bulgaria are Egyptian (54.3%, a difference of 0.0%), Immigrants from Saudi Arabia (54.2%, a difference of 0.060%), Immigrants from Hungary (54.2%, a difference of 0.070%), Turkish (54.3%, a difference of 0.090%), and Immigrants from Chile (54.2%, a difference of 0.090%). Similarly, the demographic groups most similar to Immigrants from Singapore are Taiwanese (53.9%, a difference of 0.010%), Kiowa (53.9%, a difference of 0.010%), South American Indian (53.9%, a difference of 0.040%), Immigrants from Argentina (53.9%, a difference of 0.10%), and Immigrants from Burma/Myanmar (53.9%, a difference of 0.14%).
| Demographics | Rating | Rank | 2 or more Vehicles in Household |
| Cheyenne | 13.6 /100 | #205 | Poor 54.3% |
| Immigrants | Latin America | 13.1 /100 | #206 | Poor 54.3% |
| Turks | 13.0 /100 | #207 | Poor 54.3% |
| Egyptians | 12.0 /100 | #208 | Poor 54.3% |
| Immigrants | Bulgaria | 12.0 /100 | #209 | Poor 54.3% |
| Immigrants | Saudi Arabia | 11.3 /100 | #210 | Poor 54.2% |
| Immigrants | Hungary | 11.3 /100 | #211 | Poor 54.2% |
| Immigrants | Chile | 11.1 /100 | #212 | Poor 54.2% |
| Guatemalans | 9.6 /100 | #213 | Tragic 54.1% |
| Immigrants | Czechoslovakia | 9.4 /100 | #214 | Tragic 54.1% |
| Aleuts | 9.3 /100 | #215 | Tragic 54.1% |
| Immigrants | Western Asia | 9.3 /100 | #216 | Tragic 54.1% |
| Immigrants | Burma/Myanmar | 7.1 /100 | #217 | Tragic 53.9% |
| Immigrants | Argentina | 6.8 /100 | #218 | Tragic 53.9% |
| South American Indians | 6.5 /100 | #219 | Tragic 53.9% |
| Taiwanese | 6.3 /100 | #220 | Tragic 53.9% |
| Immigrants | Singapore | 6.3 /100 | #221 | Tragic 53.9% |
| Kiowa | 6.2 /100 | #222 | Tragic 53.9% |
| Immigrants | Bosnia and Herzegovina | 5.5 /100 | #223 | Tragic 53.8% |
| Brazilians | 5.3 /100 | #224 | Tragic 53.8% |
| Immigrants | Egypt | 5.2 /100 | #225 | Tragic 53.8% |