Colombian vs Immigrants from Jordan 2 or more Vehicles in Household
COMPARE
Colombian
Immigrants from Jordan
2 or more Vehicles in Household
2 or more Vehicles in Household Comparison
Colombians
Immigrants from Jordan
52.9%
2 OR MORE VEHICLES IN HOUSEHOLD
1.1/ 100
METRIC RATING
248th/ 347
METRIC RANK
57.2%
2 OR MORE VEHICLES IN HOUSEHOLD
96.6/ 100
METRIC RATING
116th/ 347
METRIC RANK
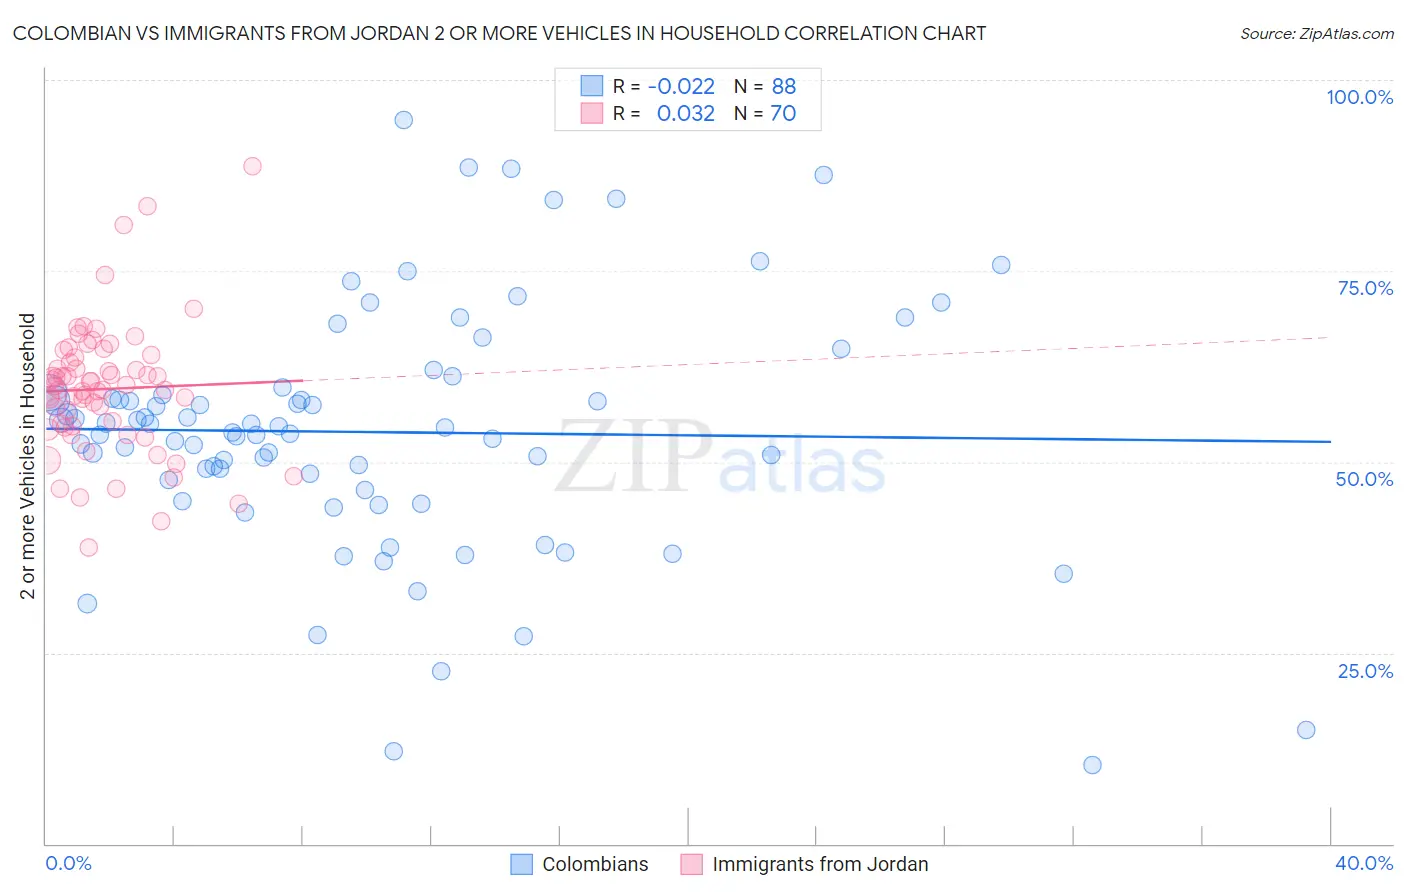
Colombian vs Immigrants from Jordan 2 or more Vehicles in Household Correlation Chart
The statistical analysis conducted on geographies consisting of 419,364,720 people shows no correlation between the proportion of Colombians and percentage of households with 2 or more vehicles available in the United States with a correlation coefficient (R) of -0.022 and weighted average of 52.9%. Similarly, the statistical analysis conducted on geographies consisting of 181,252,999 people shows no correlation between the proportion of Immigrants from Jordan and percentage of households with 2 or more vehicles available in the United States with a correlation coefficient (R) of 0.032 and weighted average of 57.2%, a difference of 8.2%.
2 or more Vehicles in Household Correlation Summary
| Measurement | Colombian | Immigrants from Jordan |
| Minimum | 10.3% | 38.9% |
| Maximum | 94.8% | 88.8% |
| Range | 84.5% | 49.9% |
| Mean | 53.9% | 59.5% |
| Median | 54.2% | 59.7% |
| Interquartile 25% (IQ1) | 46.9% | 54.7% |
| Interquartile 75% (IQ3) | 58.9% | 63.6% |
| Interquartile Range (IQR) | 12.0% | 8.9% |
| Standard Deviation (Sample) | 16.1% | 8.6% |
| Standard Deviation (Population) | 16.0% | 8.6% |
Similar Demographics by 2 or more Vehicles in Household
Demographics Similar to Colombians by 2 or more Vehicles in Household
In terms of 2 or more vehicles in household, the demographic groups most similar to Colombians are Immigrants from Brazil (52.8%, a difference of 0.060%), Mongolian (52.8%, a difference of 0.060%), Immigrants from Sudan (52.8%, a difference of 0.090%), Immigrants from Portugal (52.8%, a difference of 0.10%), and Sierra Leonean (52.9%, a difference of 0.12%).
| Demographics | Rating | Rank | 2 or more Vehicles in Household |
| Immigrants | Sierra Leone | 2.1 /100 | #241 | Tragic 53.2% |
| Immigrants | Eastern Asia | 2.1 /100 | #242 | Tragic 53.2% |
| Ethiopians | 1.7 /100 | #243 | Tragic 53.1% |
| Indians (Asian) | 1.7 /100 | #244 | Tragic 53.1% |
| Immigrants | Ethiopia | 1.5 /100 | #245 | Tragic 53.0% |
| Immigrants | Nigeria | 1.2 /100 | #246 | Tragic 52.9% |
| Sierra Leoneans | 1.2 /100 | #247 | Tragic 52.9% |
| Colombians | 1.1 /100 | #248 | Tragic 52.9% |
| Immigrants | Brazil | 1.0 /100 | #249 | Tragic 52.8% |
| Mongolians | 1.0 /100 | #250 | Tragic 52.8% |
| Immigrants | Sudan | 1.0 /100 | #251 | Tragic 52.8% |
| Immigrants | Portugal | 1.0 /100 | #252 | Tragic 52.8% |
| Nigerians | 0.9 /100 | #253 | Tragic 52.8% |
| Immigrants | Malaysia | 0.8 /100 | #254 | Tragic 52.7% |
| Uruguayans | 0.7 /100 | #255 | Tragic 52.7% |
Demographics Similar to Immigrants from Jordan by 2 or more Vehicles in Household
In terms of 2 or more vehicles in household, the demographic groups most similar to Immigrants from Jordan are Chippewa (57.2%, a difference of 0.010%), Immigrants from Lebanon (57.2%, a difference of 0.070%), Zimbabwean (57.2%, a difference of 0.10%), Iraqi (57.1%, a difference of 0.19%), and Asian (57.0%, a difference of 0.36%).
| Demographics | Rating | Rank | 2 or more Vehicles in Household |
| Immigrants | North America | 98.1 /100 | #109 | Exceptional 57.5% |
| Japanese | 98.0 /100 | #110 | Exceptional 57.5% |
| Greeks | 98.0 /100 | #111 | Exceptional 57.5% |
| Pueblo | 98.0 /100 | #112 | Exceptional 57.5% |
| Zimbabweans | 96.9 /100 | #113 | Exceptional 57.2% |
| Immigrants | Lebanon | 96.8 /100 | #114 | Exceptional 57.2% |
| Chippewa | 96.6 /100 | #115 | Exceptional 57.2% |
| Immigrants | Jordan | 96.6 /100 | #116 | Exceptional 57.2% |
| Iraqis | 95.8 /100 | #117 | Exceptional 57.1% |
| Asians | 95.1 /100 | #118 | Exceptional 57.0% |
| Natives/Alaskans | 95.0 /100 | #119 | Exceptional 57.0% |
| Costa Ricans | 94.7 /100 | #120 | Exceptional 56.9% |
| Sioux | 93.8 /100 | #121 | Exceptional 56.8% |
| Immigrants | South Africa | 92.5 /100 | #122 | Exceptional 56.7% |
| Australians | 91.8 /100 | #123 | Exceptional 56.7% |