Colombian Disability
COMPARE
Colombian
Select to Compare
Disability
Colombian Disability
11.0%
DISABILITY
99.6/ 100
METRIC RATING
67th/ 347
METRIC RANK
Colombian Disability Correlation Chart
The statistical analysis conducted on geographies consisting of 419,613,983 people shows no correlation between the proportion of Colombians and percentage of population with a disability in the United States with a correlation coefficient (R) of 0.032 and weighted average of 11.0%. On average, for every 1% (one percent) increase in Colombians within a typical geography, there is an increase of 0.012% in percentage of population with a disability.
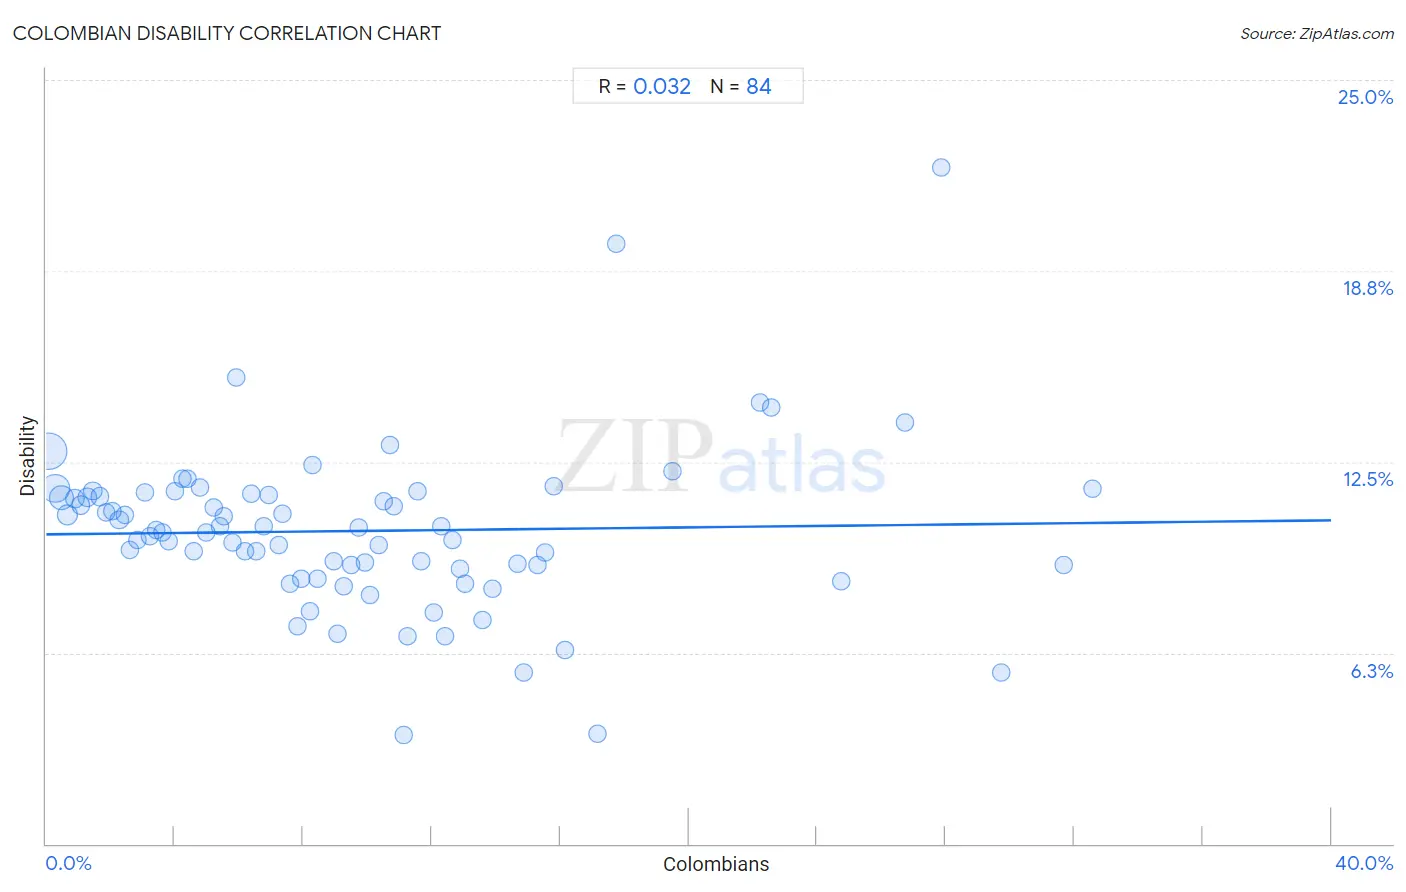
It is essential to understand that the correlation between the percentage of Colombians and percentage of population with a disability does not imply a direct cause-and-effect relationship. It remains uncertain whether the presence of Colombians influences an upward or downward trend in the level of percentage of population with a disability within an area, or if Colombians simply ended up residing in those areas with higher or lower levels of percentage of population with a disability due to other factors.
Demographics Similar to Colombians by Disability
In terms of disability, the demographic groups most similar to Colombians are Laotian (11.0%, a difference of 0.080%), Bulgarian (11.0%, a difference of 0.10%), Immigrants from Sweden (11.0%, a difference of 0.11%), Immigrants from Afghanistan (11.0%, a difference of 0.12%), and Immigrants from Eritrea (11.0%, a difference of 0.30%).
| Demographics | Rating | Rank | Disability |
| Zimbabweans | 99.7 /100 | #60 | Exceptional 10.9% |
| Immigrants from Bulgaria | 99.7 /100 | #61 | Exceptional 10.9% |
| Immigrants from Northern Africa | 99.7 /100 | #62 | Exceptional 10.9% |
| Immigrants from Eritrea | 99.7 /100 | #63 | Exceptional 11.0% |
| Immigrants from Sweden | 99.6 /100 | #64 | Exceptional 11.0% |
| Bulgarians | 99.6 /100 | #65 | Exceptional 11.0% |
| Laotians | 99.6 /100 | #66 | Exceptional 11.0% |
| Colombians | 99.6 /100 | #67 | Exceptional 11.0% |
| Immigrants from Afghanistan | 99.6 /100 | #68 | Exceptional 11.0% |
| Sri Lankans | 99.5 /100 | #69 | Exceptional 11.0% |
| Immigrants from France | 99.4 /100 | #70 | Exceptional 11.0% |
| Immigrants from Lebanon | 99.4 /100 | #71 | Exceptional 11.0% |
| Immigrants from Chile | 99.4 /100 | #72 | Exceptional 11.0% |
| Immigrants from Bangladesh | 99.4 /100 | #73 | Exceptional 11.0% |
| Immigrants from Serbia | 99.4 /100 | #74 | Exceptional 11.0% |
Colombian Disability Correlation Summary
| Measurement | Colombian Data | Disability Data |
| Minimum | 0.096% | 3.5% |
| Maximum | 32.6% | 22.2% |
| Range | 32.5% | 18.6% |
| Mean | 9.7% | 10.2% |
| Median | 8.2% | 10.2% |
| Interquartile 25% (IQ1) | 4.1% | 9.1% |
| Interquartile 75% (IQ3) | 12.8% | 11.4% |
| Interquartile Range (IQR) | 8.6% | 2.4% |
| Standard Deviation (Sample) | 7.5% | 2.7% |
| Standard Deviation (Population) | 7.4% | 2.7% |
Correlation Details
| Colombian Percentile | Sample Size | Disability |
[ 0.0% - 0.5% ] 0.096% | 170,472,413 | 12.8% |
[ 0.0% - 0.5% ] 0.28% | 97,617,691 | 11.6% |
[ 0.0% - 0.5% ] 0.47% | 53,403,097 | 11.3% |
[ 0.5% - 1.0% ] 0.67% | 24,478,598 | 10.8% |
[ 0.5% - 1.0% ] 0.88% | 13,425,578 | 11.3% |
[ 1.0% - 1.5% ] 1.07% | 8,602,694 | 11.1% |
[ 1.0% - 1.5% ] 1.27% | 15,204,724 | 11.3% |
[ 1.0% - 1.5% ] 1.46% | 5,920,823 | 11.5% |
[ 1.5% - 2.0% ] 1.66% | 3,983,056 | 11.4% |
[ 1.5% - 2.0% ] 1.85% | 2,531,100 | 10.9% |
[ 2.0% - 2.5% ] 2.05% | 2,473,228 | 10.9% |
[ 2.0% - 2.5% ] 2.27% | 1,703,070 | 10.6% |
[ 2.0% - 2.5% ] 2.46% | 1,715,202 | 10.8% |
[ 2.5% - 3.0% ] 2.62% | 1,773,508 | 9.6% |
[ 2.5% - 3.0% ] 2.83% | 1,142,719 | 9.9% |
[ 3.0% - 3.5% ] 3.07% | 1,397,308 | 11.5% |
[ 3.0% - 3.5% ] 3.25% | 658,752 | 10.1% |
[ 3.0% - 3.5% ] 3.42% | 926,510 | 10.3% |
[ 3.5% - 4.0% ] 3.63% | 1,012,035 | 10.2% |
[ 3.5% - 4.0% ] 3.81% | 762,416 | 9.9% |
[ 3.5% - 4.0% ] 4.00% | 714,036 | 11.5% |
[ 4.0% - 4.5% ] 4.24% | 1,249,112 | 11.9% |
[ 4.0% - 4.5% ] 4.40% | 639,472 | 11.9% |
[ 4.5% - 5.0% ] 4.58% | 586,289 | 9.6% |
[ 4.5% - 5.0% ] 4.78% | 425,272 | 11.7% |
[ 4.5% - 5.0% ] 4.99% | 420,845 | 10.2% |
[ 5.0% - 5.5% ] 5.20% | 545,688 | 11.0% |
[ 5.0% - 5.5% ] 5.40% | 431,367 | 10.4% |
[ 5.5% - 6.0% ] 5.54% | 329,163 | 10.7% |
[ 5.5% - 6.0% ] 5.79% | 319,482 | 9.9% |
[ 5.5% - 6.0% ] 5.91% | 86,762 | 15.3% |
[ 6.0% - 6.5% ] 6.18% | 396,251 | 9.6% |
[ 6.0% - 6.5% ] 6.38% | 496,058 | 11.5% |
[ 6.5% - 7.0% ] 6.54% | 378,044 | 9.6% |
[ 6.5% - 7.0% ] 6.76% | 337,728 | 10.4% |
[ 6.5% - 7.0% ] 6.94% | 182,201 | 11.4% |
[ 7.0% - 7.5% ] 7.23% | 88,611 | 9.8% |
[ 7.0% - 7.5% ] 7.35% | 446,829 | 10.8% |
[ 7.5% - 8.0% ] 7.58% | 77,985 | 8.5% |
[ 7.5% - 8.0% ] 7.80% | 78,531 | 7.1% |
[ 7.5% - 8.0% ] 7.94% | 140,425 | 8.7% |
[ 8.0% - 8.5% ] 8.21% | 137,791 | 7.6% |
[ 8.0% - 8.5% ] 8.27% | 72,409 | 12.4% |
[ 8.0% - 8.5% ] 8.46% | 61,991 | 8.7% |
[ 8.5% - 9.0% ] 8.95% | 135,455 | 9.3% |
[ 9.0% - 9.5% ] 9.05% | 56,025 | 6.9% |
[ 9.0% - 9.5% ] 9.26% | 75,971 | 8.4% |
[ 9.5% - 10.0% ] 9.50% | 11,577 | 9.1% |
[ 9.5% - 10.0% ] 9.73% | 130,920 | 10.4% |
[ 9.5% - 10.0% ] 9.94% | 32,881 | 9.2% |
[ 10.0% - 10.5% ] 10.06% | 75,956 | 8.1% |
[ 10.0% - 10.5% ] 10.36% | 167,404 | 9.8% |
[ 10.0% - 10.5% ] 10.49% | 67,818 | 11.2% |
[ 10.5% - 11.0% ] 10.70% | 121,169 | 13.0% |
[ 10.5% - 11.0% ] 10.81% | 74,601 | 11.0% |
[ 11.0% - 11.5% ] 11.13% | 593 | 3.5% |
[ 11.0% - 11.5% ] 11.23% | 69,599 | 6.8% |
[ 11.5% - 12.0% ] 11.55% | 42,940 | 11.5% |
[ 11.5% - 12.0% ] 11.68% | 8,024 | 9.2% |
[ 12.0% - 12.5% ] 12.07% | 149,116 | 7.6% |
[ 12.0% - 12.5% ] 12.29% | 46,195 | 10.4% |
[ 12.0% - 12.5% ] 12.43% | 118,135 | 6.8% |
[ 12.5% - 13.0% ] 12.65% | 50,975 | 9.9% |
[ 12.5% - 13.0% ] 12.87% | 119,388 | 9.0% |
[ 13.0% - 13.5% ] 13.05% | 21,715 | 8.5% |
[ 13.5% - 14.0% ] 13.58% | 31,514 | 7.3% |
[ 13.5% - 14.0% ] 13.88% | 26,548 | 8.3% |
[ 14.5% - 15.0% ] 14.68% | 42,427 | 9.2% |
[ 14.5% - 15.0% ] 14.86% | 498 | 5.6% |
[ 15.0% - 15.5% ] 15.31% | 18,601 | 9.1% |
[ 15.5% - 16.0% ] 15.53% | 45,191 | 9.5% |
[ 15.5% - 16.0% ] 15.80% | 1,829 | 11.7% |
[ 16.0% - 16.5% ] 16.14% | 11,069 | 6.4% |
[ 17.0% - 17.5% ] 17.15% | 1,026 | 3.6% |
[ 17.5% - 18.0% ] 17.74% | 530 | 19.6% |
[ 19.5% - 20.0% ] 19.51% | 41 | 12.2% |
[ 22.0% - 22.5% ] 22.22% | 180 | 14.4% |
[ 22.5% - 23.0% ] 22.56% | 133 | 14.3% |
[ 24.5% - 25.0% ] 24.77% | 6,186 | 8.6% |
[ 26.5% - 27.0% ] 26.72% | 116 | 13.8% |
[ 27.5% - 28.0% ] 27.85% | 158 | 22.2% |
[ 29.5% - 30.0% ] 29.74% | 2,811 | 5.6% |
[ 31.5% - 32.0% ] 31.69% | 1,761 | 9.1% |
[ 32.5% - 33.0% ] 32.56% | 43 | 11.6% |