Colombian vs Immigrants from Liberia 2 or more Vehicles in Household
COMPARE
Colombian
Immigrants from Liberia
2 or more Vehicles in Household
2 or more Vehicles in Household Comparison
Colombians
Immigrants from Liberia
52.9%
2 OR MORE VEHICLES IN HOUSEHOLD
1.1/ 100
METRIC RATING
248th/ 347
METRIC RANK
51.3%
2 OR MORE VEHICLES IN HOUSEHOLD
0.1/ 100
METRIC RATING
286th/ 347
METRIC RANK
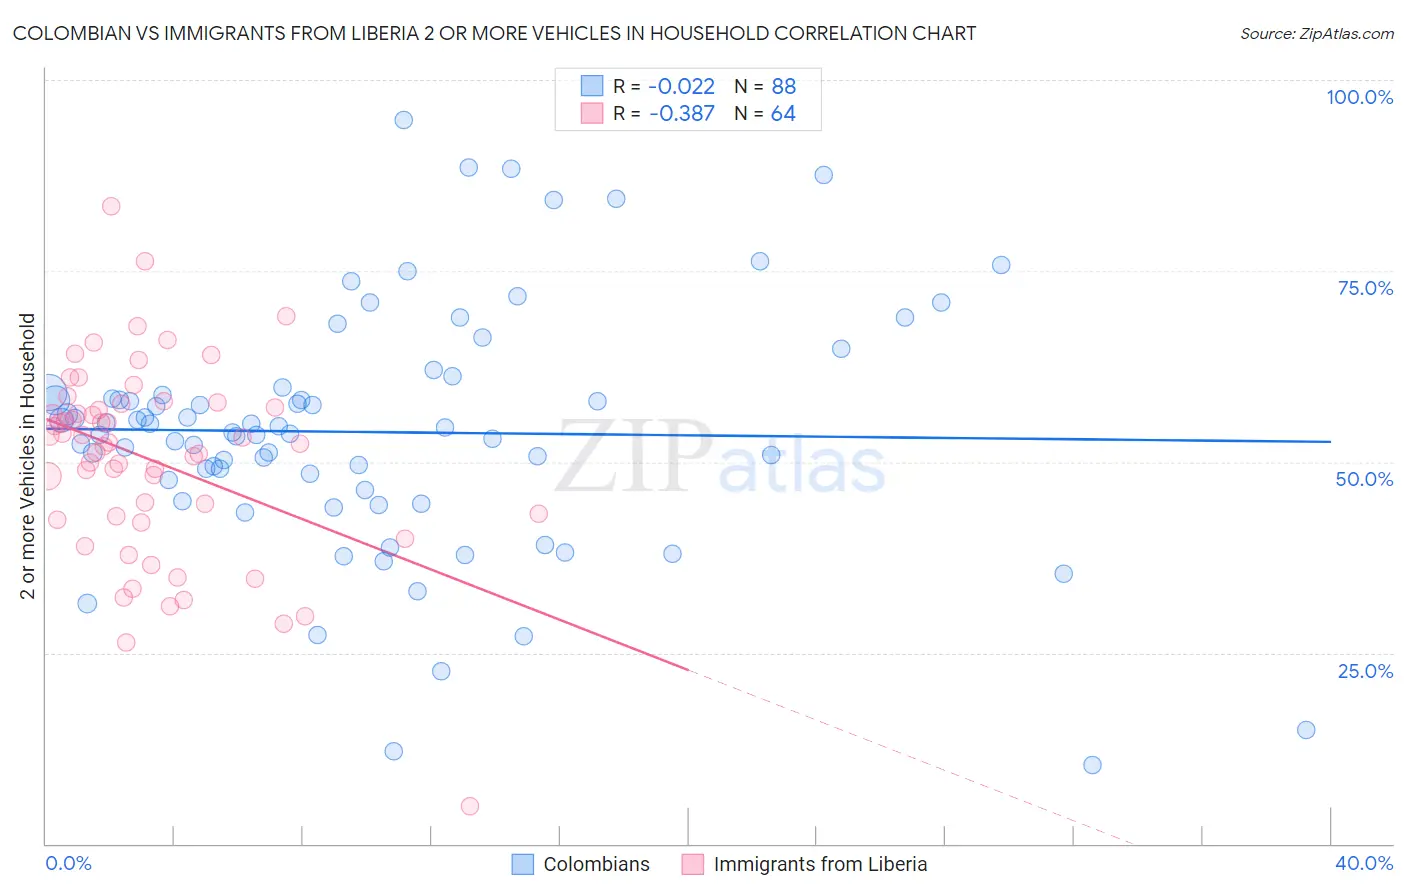
Colombian vs Immigrants from Liberia 2 or more Vehicles in Household Correlation Chart
The statistical analysis conducted on geographies consisting of 419,364,720 people shows no correlation between the proportion of Colombians and percentage of households with 2 or more vehicles available in the United States with a correlation coefficient (R) of -0.022 and weighted average of 52.9%. Similarly, the statistical analysis conducted on geographies consisting of 135,251,590 people shows a mild negative correlation between the proportion of Immigrants from Liberia and percentage of households with 2 or more vehicles available in the United States with a correlation coefficient (R) of -0.387 and weighted average of 51.3%, a difference of 3.0%.
2 or more Vehicles in Household Correlation Summary
| Measurement | Colombian | Immigrants from Liberia |
| Minimum | 10.3% | 4.9% |
| Maximum | 94.8% | 83.5% |
| Range | 84.5% | 78.6% |
| Mean | 53.9% | 50.3% |
| Median | 54.2% | 52.4% |
| Interquartile 25% (IQ1) | 46.9% | 42.7% |
| Interquartile 75% (IQ3) | 58.9% | 57.4% |
| Interquartile Range (IQR) | 12.0% | 14.7% |
| Standard Deviation (Sample) | 16.1% | 13.0% |
| Standard Deviation (Population) | 16.0% | 12.9% |
Similar Demographics by 2 or more Vehicles in Household
Demographics Similar to Colombians by 2 or more Vehicles in Household
In terms of 2 or more vehicles in household, the demographic groups most similar to Colombians are Immigrants from Brazil (52.8%, a difference of 0.060%), Mongolian (52.8%, a difference of 0.060%), Immigrants from Sudan (52.8%, a difference of 0.090%), Immigrants from Portugal (52.8%, a difference of 0.10%), and Sierra Leonean (52.9%, a difference of 0.12%).
| Demographics | Rating | Rank | 2 or more Vehicles in Household |
| Immigrants | Sierra Leone | 2.1 /100 | #241 | Tragic 53.2% |
| Immigrants | Eastern Asia | 2.1 /100 | #242 | Tragic 53.2% |
| Ethiopians | 1.7 /100 | #243 | Tragic 53.1% |
| Indians (Asian) | 1.7 /100 | #244 | Tragic 53.1% |
| Immigrants | Ethiopia | 1.5 /100 | #245 | Tragic 53.0% |
| Immigrants | Nigeria | 1.2 /100 | #246 | Tragic 52.9% |
| Sierra Leoneans | 1.2 /100 | #247 | Tragic 52.9% |
| Colombians | 1.1 /100 | #248 | Tragic 52.9% |
| Immigrants | Brazil | 1.0 /100 | #249 | Tragic 52.8% |
| Mongolians | 1.0 /100 | #250 | Tragic 52.8% |
| Immigrants | Sudan | 1.0 /100 | #251 | Tragic 52.8% |
| Immigrants | Portugal | 1.0 /100 | #252 | Tragic 52.8% |
| Nigerians | 0.9 /100 | #253 | Tragic 52.8% |
| Immigrants | Malaysia | 0.8 /100 | #254 | Tragic 52.7% |
| Uruguayans | 0.7 /100 | #255 | Tragic 52.7% |
Demographics Similar to Immigrants from Liberia by 2 or more Vehicles in Household
In terms of 2 or more vehicles in household, the demographic groups most similar to Immigrants from Liberia are Immigrants from Serbia (51.3%, a difference of 0.020%), Immigrants from Uruguay (51.4%, a difference of 0.14%), Okinawan (51.2%, a difference of 0.14%), Immigrants from Zaire (51.5%, a difference of 0.30%), and Immigrants from China (51.5%, a difference of 0.34%).
| Demographics | Rating | Rank | 2 or more Vehicles in Household |
| Liberians | 0.1 /100 | #279 | Tragic 51.7% |
| Immigrants | Eastern Europe | 0.1 /100 | #280 | Tragic 51.7% |
| Immigrants | Kazakhstan | 0.1 /100 | #281 | Tragic 51.6% |
| Bahamians | 0.1 /100 | #282 | Tragic 51.5% |
| Immigrants | China | 0.1 /100 | #283 | Tragic 51.5% |
| Immigrants | Zaire | 0.1 /100 | #284 | Tragic 51.5% |
| Immigrants | Uruguay | 0.1 /100 | #285 | Tragic 51.4% |
| Immigrants | Liberia | 0.1 /100 | #286 | Tragic 51.3% |
| Immigrants | Serbia | 0.1 /100 | #287 | Tragic 51.3% |
| Okinawans | 0.1 /100 | #288 | Tragic 51.2% |
| Somalis | 0.0 /100 | #289 | Tragic 51.1% |
| Immigrants | Panama | 0.0 /100 | #290 | Tragic 51.1% |
| Belizeans | 0.0 /100 | #291 | Tragic 51.0% |
| Immigrants | Ukraine | 0.0 /100 | #292 | Tragic 50.9% |
| Blacks/African Americans | 0.0 /100 | #293 | Tragic 50.9% |