Zip Codes with the Highest Percentage of Population Employed in Arts, Entertainment & Recreation in Maryville, TN
RELATED REPORTS & OPTIONS
Arts, Entertainment & Recreation
Maryville
Compare Zip Codes
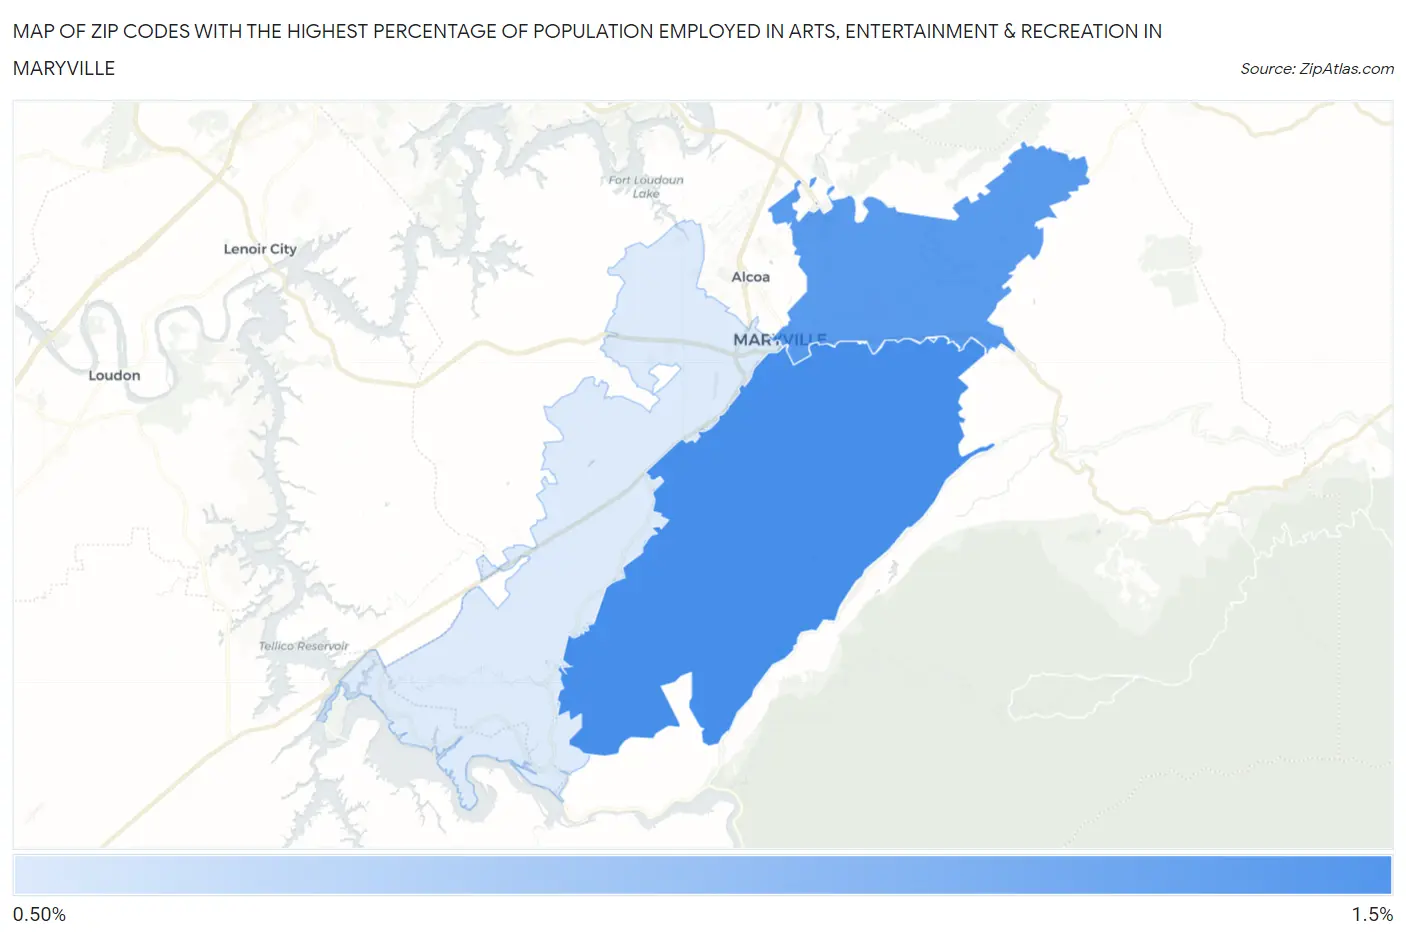
Map of Zip Codes with the Highest Percentage of Population Employed in Arts, Entertainment & Recreation in Maryville
0.71%
1.1%
Zip Codes with the Highest Percentage of Population Employed in Arts, Entertainment & Recreation in Maryville, TN
| Zip Code | % Employed | vs State | vs National | |
| 1. | 37803 | 1.1% | 1.8%(-0.723)#271 | 2.1%(-1.02)#16,510 |
| 2. | 37804 | 1.0% | 1.8%(-0.759)#278 | 2.1%(-1.05)#16,750 |
| 3. | 37801 | 0.71% | 1.8%(-1.08)#339 | 2.1%(-1.37)#19,091 |
1
Common Questions
What are the Top Zip Codes with the Highest Percentage of Population Employed in Arts, Entertainment & Recreation in Maryville, TN?
Top Zip Codes with the Highest Percentage of Population Employed in Arts, Entertainment & Recreation in Maryville, TN are:
What zip code has the Highest Percentage of Population Employed in Arts, Entertainment & Recreation in Maryville, TN?
37803 has the Highest Percentage of Population Employed in Arts, Entertainment & Recreation in Maryville, TN with 1.1%.
What is the Percentage of Population Employed in Arts, Entertainment & Recreation in Maryville, TN?
Percentage of Population Employed in Arts, Entertainment & Recreation in Maryville is 1.3%.
What is the Percentage of Population Employed in Arts, Entertainment & Recreation in Tennessee?
Percentage of Population Employed in Arts, Entertainment & Recreation in Tennessee is 1.8%.
What is the Percentage of Population Employed in Arts, Entertainment & Recreation in the United States?
Percentage of Population Employed in Arts, Entertainment & Recreation in the United States is 2.1%.