Zip Codes with the Highest Percentage of Population Employed in Transportation & Warehousing in Maryville, TN
RELATED REPORTS & OPTIONS
Transportation & Warehousing
Maryville
Compare Zip Codes
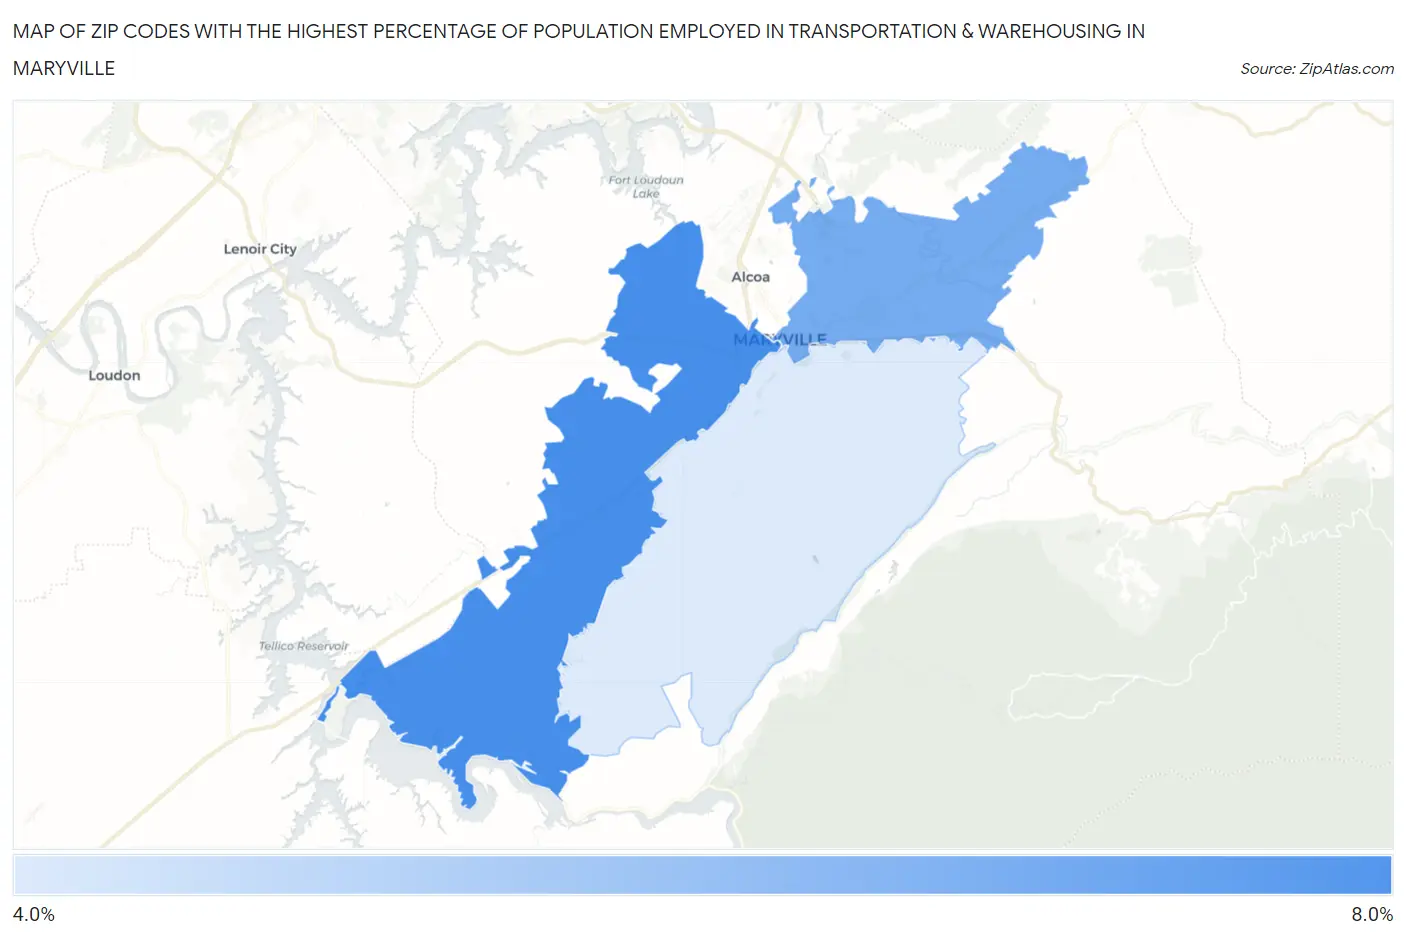
Map of Zip Codes with the Highest Percentage of Population Employed in Transportation & Warehousing in Maryville
4.4%
6.5%
Zip Codes with the Highest Percentage of Population Employed in Transportation & Warehousing in Maryville, TN
| Zip Code | % Employed | vs State | vs National | |
| 1. | 37801 | 6.5% | 6.1%(+0.428)#187 | 4.9%(+1.59)#7,489 |
| 2. | 37804 | 5.9% | 6.1%(-0.233)#230 | 4.9%(+0.932)#9,115 |
| 3. | 37803 | 4.4% | 6.1%(-1.72)#358 | 4.9%(-0.556)#14,216 |
1
Common Questions
What are the Top Zip Codes with the Highest Percentage of Population Employed in Transportation & Warehousing in Maryville, TN?
Top Zip Codes with the Highest Percentage of Population Employed in Transportation & Warehousing in Maryville, TN are:
What zip code has the Highest Percentage of Population Employed in Transportation & Warehousing in Maryville, TN?
37801 has the Highest Percentage of Population Employed in Transportation & Warehousing in Maryville, TN with 6.5%.
What is the Percentage of Population Employed in Transportation & Warehousing in Maryville, TN?
Percentage of Population Employed in Transportation & Warehousing in Maryville is 4.6%.
What is the Percentage of Population Employed in Transportation & Warehousing in Tennessee?
Percentage of Population Employed in Transportation & Warehousing in Tennessee is 6.1%.
What is the Percentage of Population Employed in Transportation & Warehousing in the United States?
Percentage of Population Employed in Transportation & Warehousing in the United States is 4.9%.