Zip Codes with the Highest Percentage of Population Employed in Legal Services & Support in Maryville, TN
RELATED REPORTS & OPTIONS
Legal Services & Support
Maryville
Compare Zip Codes
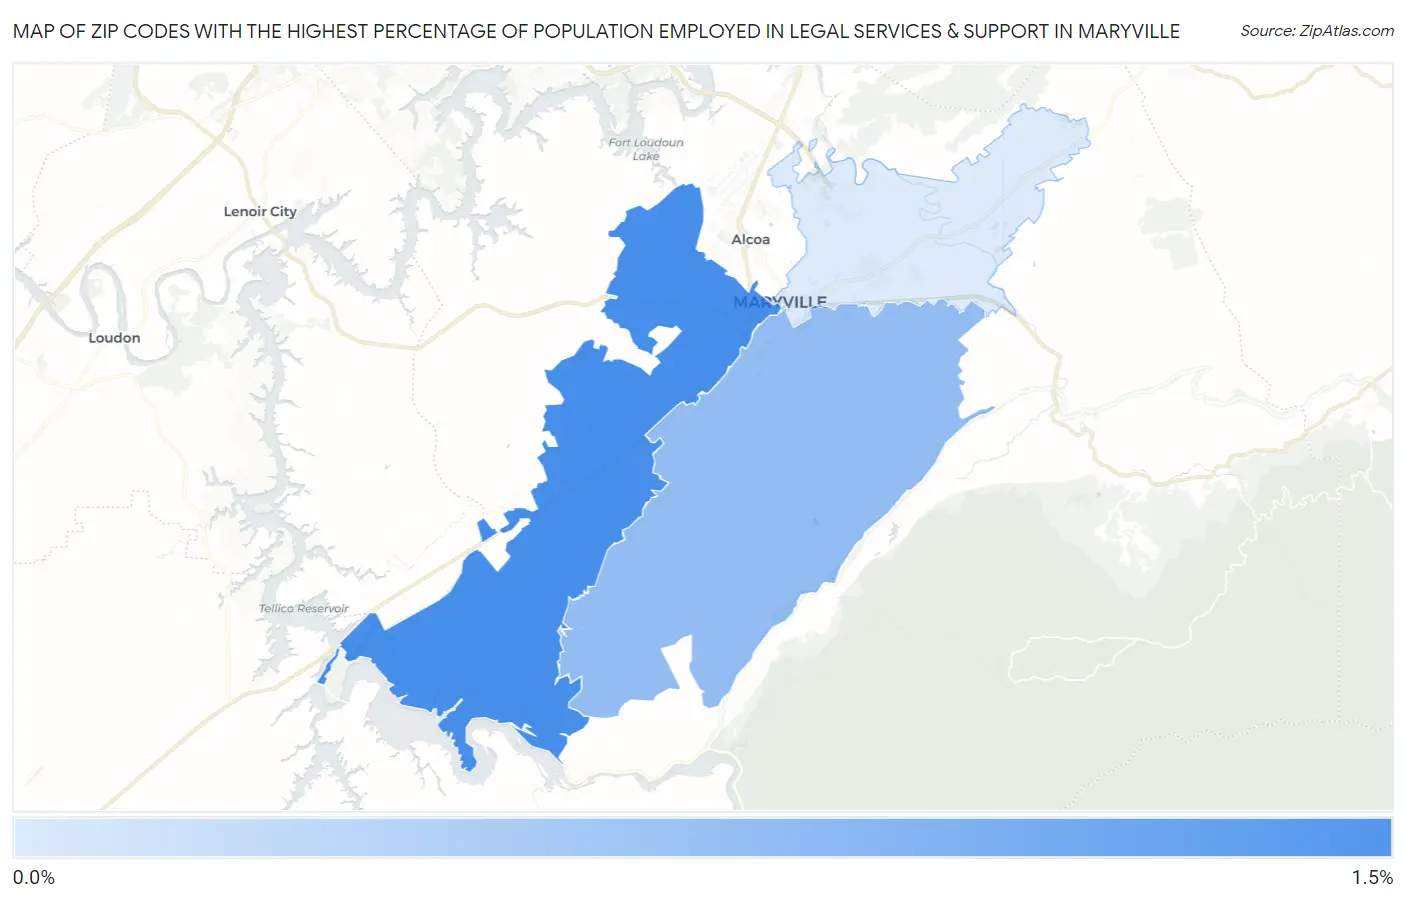
Map of Zip Codes with the Highest Percentage of Population Employed in Legal Services & Support in Maryville
0.094%
1.3%
Zip Codes with the Highest Percentage of Population Employed in Legal Services & Support in Maryville, TN
| Zip Code | % Employed | vs State | vs National | |
| 1. | 37801 | 1.3% | 0.90%(+0.421)#88 | 1.2%(+0.135)#5,838 |
| 2. | 37803 | 0.70% | 0.90%(-0.197)#172 | 1.2%(-0.483)#10,395 |
| 3. | 37804 | 0.094% | 0.90%(-0.804)#317 | 1.2%(-1.09)#17,174 |
1
Common Questions
What are the Top Zip Codes with the Highest Percentage of Population Employed in Legal Services & Support in Maryville, TN?
Top Zip Codes with the Highest Percentage of Population Employed in Legal Services & Support in Maryville, TN are:
What zip code has the Highest Percentage of Population Employed in Legal Services & Support in Maryville, TN?
37801 has the Highest Percentage of Population Employed in Legal Services & Support in Maryville, TN with 1.3%.
What is the Percentage of Population Employed in Legal Services & Support in Maryville, TN?
Percentage of Population Employed in Legal Services & Support in Maryville is 0.86%.
What is the Percentage of Population Employed in Legal Services & Support in Tennessee?
Percentage of Population Employed in Legal Services & Support in Tennessee is 0.90%.
What is the Percentage of Population Employed in Legal Services & Support in the United States?
Percentage of Population Employed in Legal Services & Support in the United States is 1.2%.