Zip Codes with the Highest Percentage of Households Heated by Bottled Gas / Liquid Propane in Maryville, TN
RELATED REPORTS & OPTIONS
Bottled Gas / LP Heating
Maryville
Compare Zip Codes
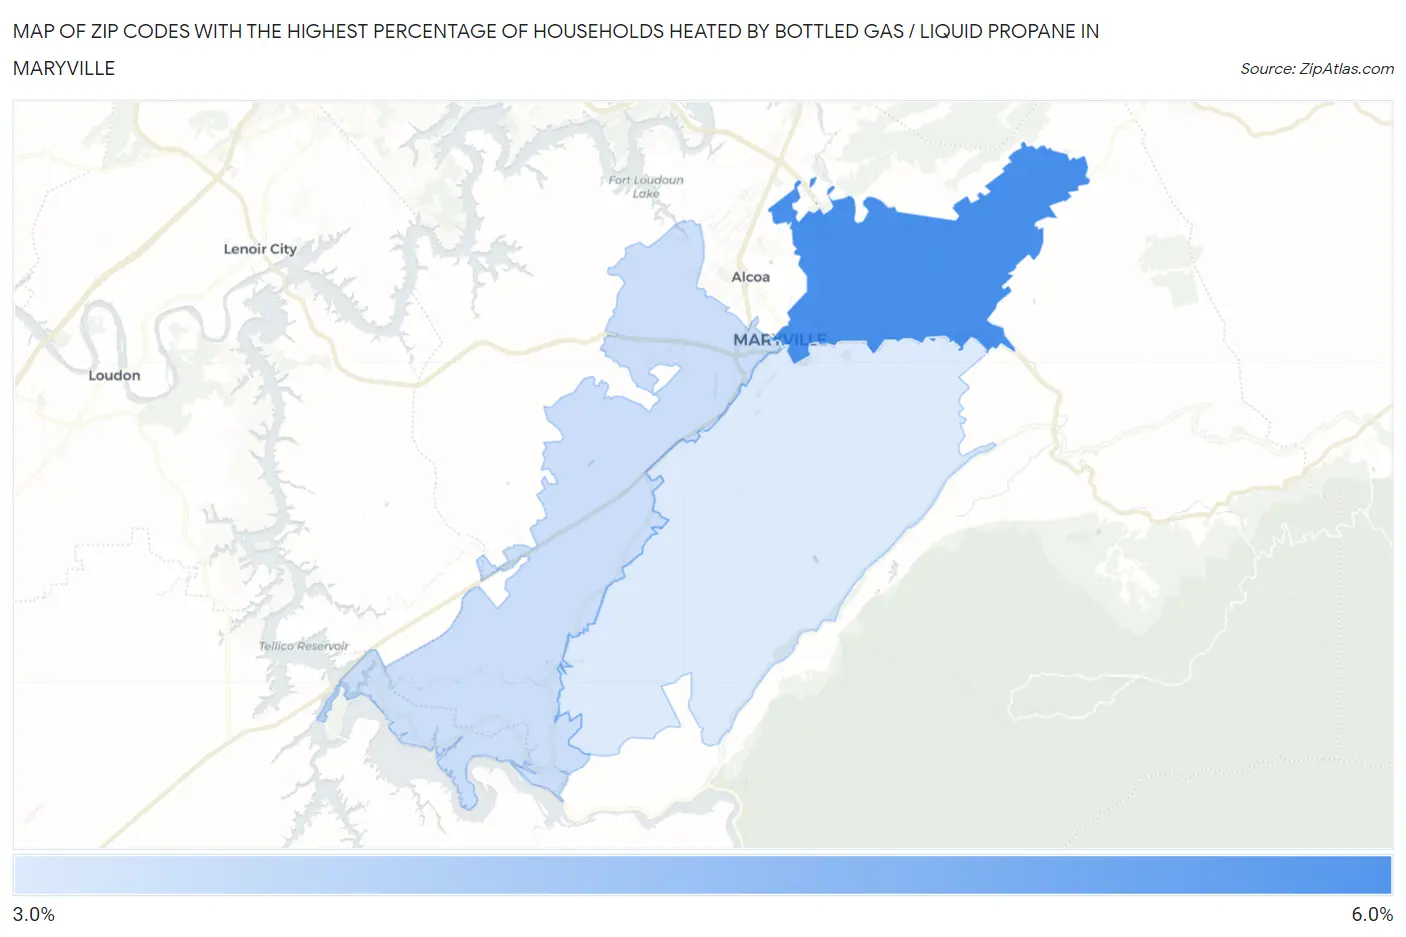
Map of Zip Codes with the Highest Percentage of Households Heated by Bottled Gas / Liquid Propane in Maryville
3.5%
5.9%
Zip Codes with the Highest Percentage of Households Heated by Bottled Gas / Liquid Propane in Maryville, TN
| Zip Code | Bottled Gas / LP Heating | vs State | vs National | |
| 1. | 37804 | 5.9% | 3.6%(+2.30)#265 | 4.9%(+1.00)#17,653 |
| 2. | 37801 | 3.8% | 3.6%(+0.200)#366 | 4.9%(-1.10)#19,860 |
| 3. | 37803 | 3.5% | 3.6%(-0.100)#382 | 4.9%(-1.40)#20,216 |
1
Common Questions
What are the Top Zip Codes with the Highest Percentage of Households Heated by Bottled Gas / Liquid Propane in Maryville, TN?
Top Zip Codes with the Highest Percentage of Households Heated by Bottled Gas / Liquid Propane in Maryville, TN are:
What zip code has the Highest Percentage of Households Heated by Bottled Gas / Liquid Propane in Maryville, TN?
37804 has the Highest Percentage of Households Heated by Bottled Gas / Liquid Propane in Maryville, TN with 5.9%.
What is the Percentage of Households Heated by Bottled Gas / Liquid Propane in Maryville, TN?
Percentage of Households Heated by Bottled Gas / Liquid Propane in Maryville is 1.1%.
What is the Percentage of Households Heated by Bottled Gas / Liquid Propane in Tennessee?
Percentage of Households Heated by Bottled Gas / Liquid Propane in Tennessee is 3.6%.
What is the Percentage of Households Heated by Bottled Gas / Liquid Propane in the United States?
Percentage of Households Heated by Bottled Gas / Liquid Propane in the United States is 4.9%.