Zip Codes with the Most Births per 1,000 Women in Labor Force in Maryville, TN
RELATED REPORTS & OPTIONS
Highest Birth Rate | In Labor Force
Maryville
Compare Zip Codes
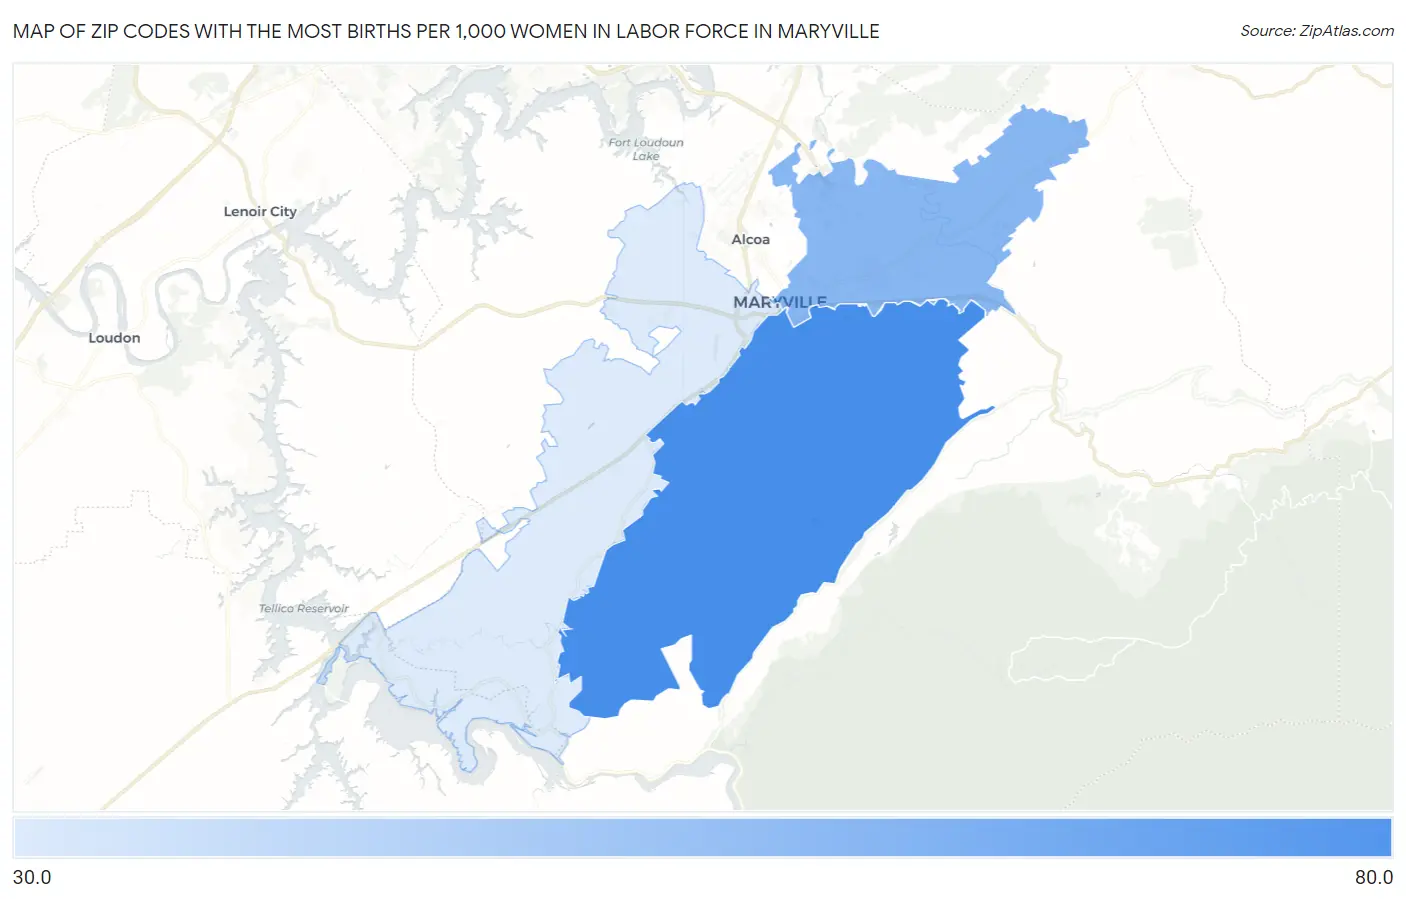
Map of Zip Codes with the Most Births per 1,000 Women in Labor Force in Maryville
32.0
67.0
Zip Codes with the Most Births per 1,000 Women in Labor Force in Maryville, TN
| Zip Code | Births / 1,000 Women | vs State | vs National | |
| 1. | 37803 | 67.0 | 47.0(+20.0)#124 | 48.0(+19.0)#7,239 |
| 2. | 37804 | 49.0 | 47.0(+2.00)#208 | 48.0(+1.000)#11,713 |
| 3. | 37801 | 32.0 | 47.0(-15.0)#331 | 48.0(-16.0)#17,112 |
1
Common Questions
What are the Top Zip Codes with the Most Births per 1,000 Women in Labor Force in Maryville, TN?
Top Zip Codes with the Most Births per 1,000 Women in Labor Force in Maryville, TN are:
What zip code has the Most Births per 1,000 Women in Labor Force in Maryville, TN?
37803 has the Most Births per 1,000 Women in Labor Force in Maryville, TN with 67.0.
What is the Number of Births per 1,000 Women in Labor Force in Maryville, TN?
Number of Births per 1,000 Women in Labor Force in Maryville is 25.0.
What is the Number of Births per 1,000 Women in Labor Force in Tennessee?
Number of Births per 1,000 Women in Labor Force in Tennessee is 47.0.
What is the Number of Births per 1,000 Women in Labor Force in the United States?
Number of Births per 1,000 Women in Labor Force in the United States is 48.0.