Zip Codes with the Highest Percentage of Population with a Degree in Visual and Performing Arts in Maryville, TN
RELATED REPORTS & OPTIONS
Visual and Performing Arts
Maryville
Compare Zip Codes
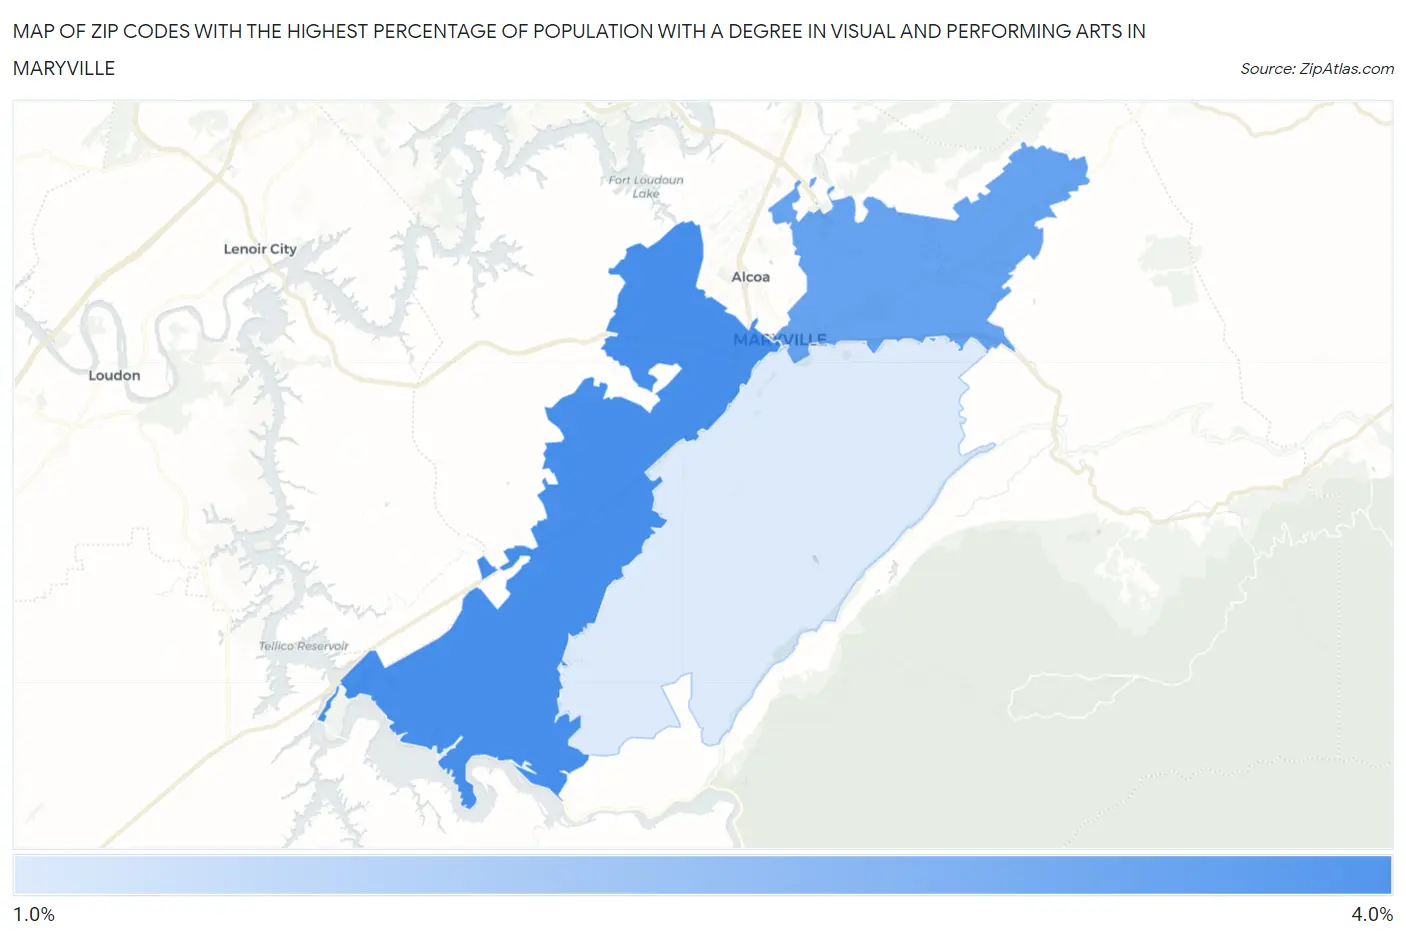
Map of Zip Codes with the Highest Percentage of Population with a Degree in Visual and Performing Arts in Maryville
1.4%
3.3%
Zip Codes with the Highest Percentage of Population with a Degree in Visual and Performing Arts in Maryville, TN
| Zip Code | % Graduates | vs State | vs National | |
| 1. | 37801 | 3.3% | 4.1%(-0.754)#218 | 4.3%(-0.941)#11,566 |
| 2. | 37804 | 2.9% | 4.1%(-1.14)#237 | 4.3%(-1.32)#12,986 |
| 3. | 37803 | 1.4% | 4.1%(-2.65)#340 | 4.3%(-2.84)#18,422 |
1
Common Questions
What are the Top Zip Codes with the Highest Percentage of Population with a Degree in Visual and Performing Arts in Maryville, TN?
Top Zip Codes with the Highest Percentage of Population with a Degree in Visual and Performing Arts in Maryville, TN are:
What zip code has the Highest Percentage of Population with a Degree in Visual and Performing Arts in Maryville, TN?
37801 has the Highest Percentage of Population with a Degree in Visual and Performing Arts in Maryville, TN with 3.3%.
What is the Percentage of Population with a Degree in Visual and Performing Arts in Maryville, TN?
Percentage of Population with a Degree in Visual and Performing Arts in Maryville is 1.4%.
What is the Percentage of Population with a Degree in Visual and Performing Arts in Tennessee?
Percentage of Population with a Degree in Visual and Performing Arts in Tennessee is 4.1%.
What is the Percentage of Population with a Degree in Visual and Performing Arts in the United States?
Percentage of Population with a Degree in Visual and Performing Arts in the United States is 4.3%.