Zip Codes with the Highest Percentage of Population with a Degree in Engineering in Maryville, TN
RELATED REPORTS & OPTIONS
Engineering
Maryville
Compare Zip Codes
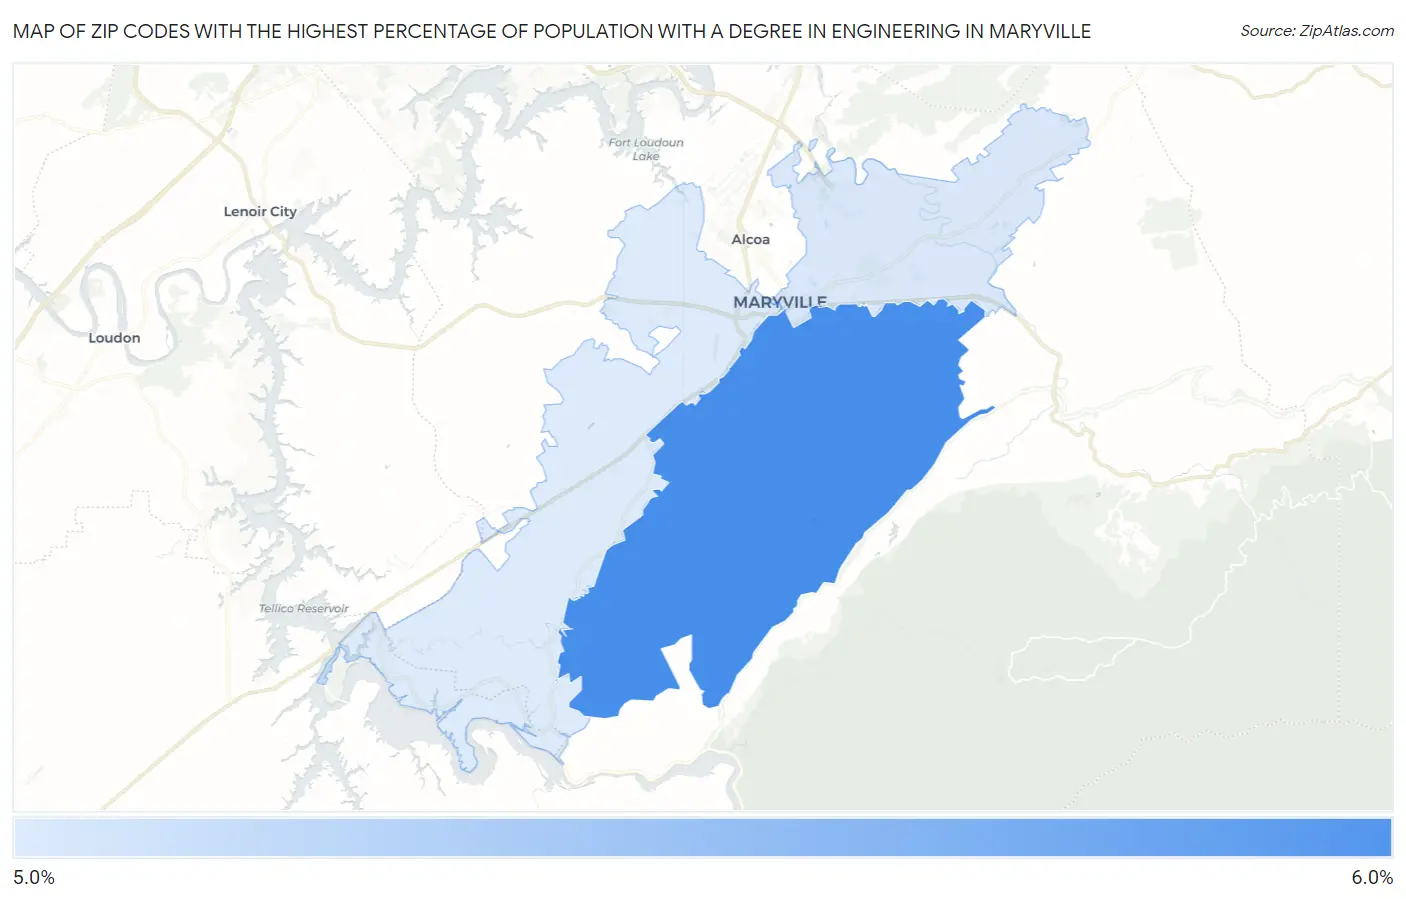
Map of Zip Codes with the Highest Percentage of Population with a Degree in Engineering in Maryville
5.1%
6.0%
Zip Codes with the Highest Percentage of Population with a Degree in Engineering in Maryville, TN
| Zip Code | % Graduates | vs State | vs National | |
| 1. | 37803 | 6.0% | 6.2%(-0.224)#211 | 7.6%(-1.69)#11,294 |
| 2. | 37804 | 5.1% | 6.2%(-1.09)#251 | 7.6%(-2.56)#13,450 |
| 3. | 37801 | 5.1% | 6.2%(-1.12)#254 | 7.6%(-2.59)#13,523 |
1
Common Questions
What are the Top Zip Codes with the Highest Percentage of Population with a Degree in Engineering in Maryville, TN?
Top Zip Codes with the Highest Percentage of Population with a Degree in Engineering in Maryville, TN are:
What zip code has the Highest Percentage of Population with a Degree in Engineering in Maryville, TN?
37803 has the Highest Percentage of Population with a Degree in Engineering in Maryville, TN with 6.0%.
What is the Percentage of Population with a Degree in Engineering in Maryville, TN?
Percentage of Population with a Degree in Engineering in Maryville is 6.3%.
What is the Percentage of Population with a Degree in Engineering in Tennessee?
Percentage of Population with a Degree in Engineering in Tennessee is 6.2%.
What is the Percentage of Population with a Degree in Engineering in the United States?
Percentage of Population with a Degree in Engineering in the United States is 7.6%.