Zip Codes with the Highest Percentage of Population Employed in Security & Protection in Chambersburg, PA
RELATED REPORTS & OPTIONS
Security & Protection
Chambersburg
Compare Zip Codes
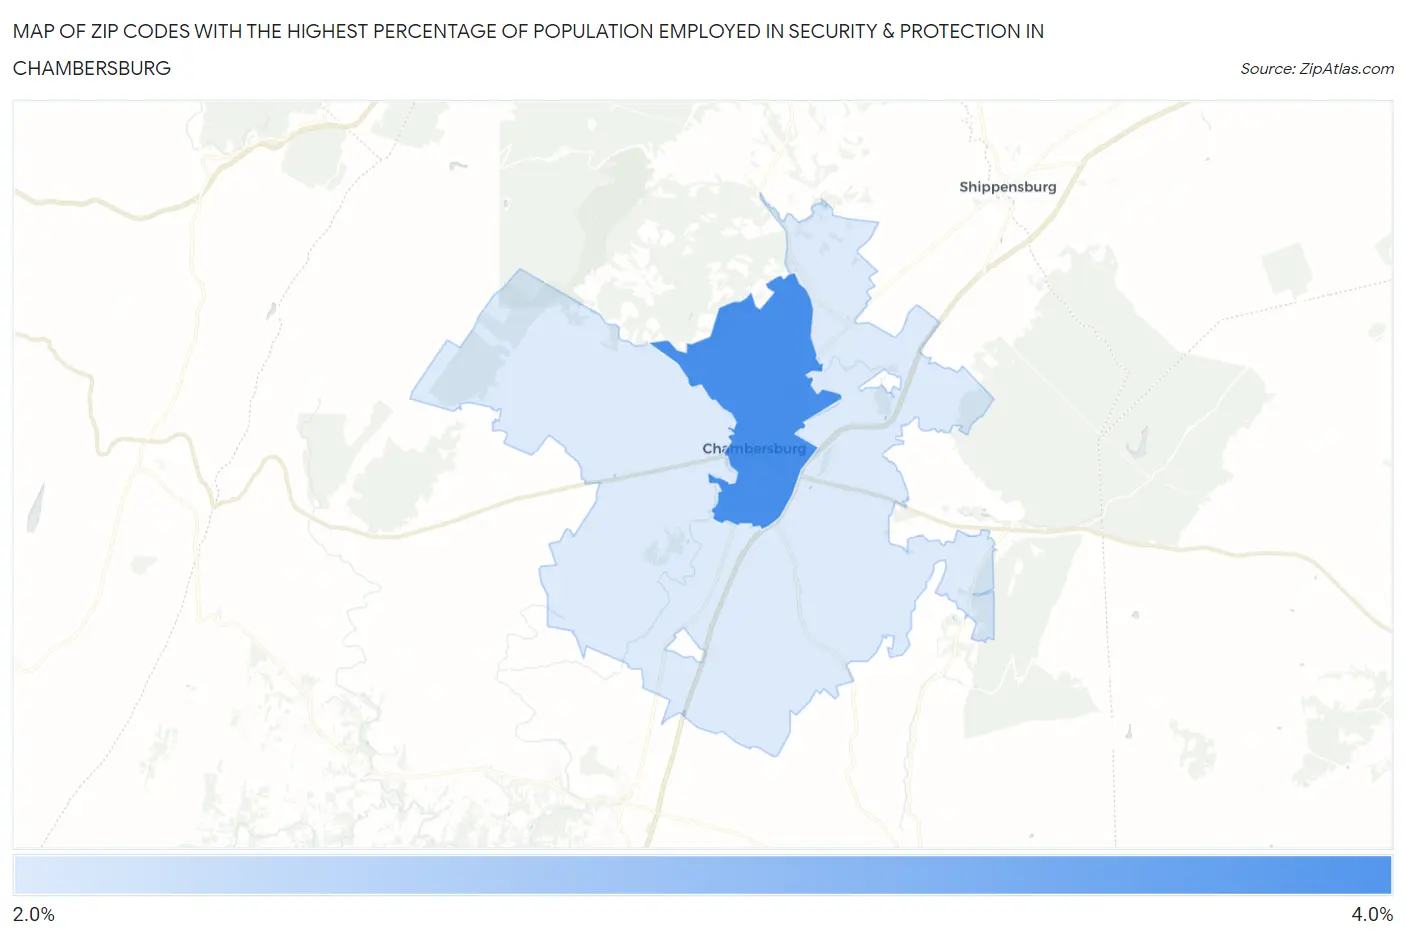
Map of Zip Codes with the Highest Percentage of Population Employed in Security & Protection in Chambersburg
2.9%
3.1%
Zip Codes with the Highest Percentage of Population Employed in Security & Protection in Chambersburg, PA
| Zip Code | % Employed | vs State | vs National | |
| 1. | 17201 | 3.1% | 2.0%(+1.12)#310 | 2.1%(+0.994)#6,724 |
| 2. | 17202 | 2.9% | 2.0%(+0.838)#362 | 2.1%(+0.710)#7,824 |
1
Common Questions
What are the Top Zip Codes with the Highest Percentage of Population Employed in Security & Protection in Chambersburg, PA?
Top Zip Codes with the Highest Percentage of Population Employed in Security & Protection in Chambersburg, PA are:
What zip code has the Highest Percentage of Population Employed in Security & Protection in Chambersburg, PA?
17201 has the Highest Percentage of Population Employed in Security & Protection in Chambersburg, PA with 3.1%.
What is the Percentage of Population Employed in Security & Protection in Pennsylvania?
Percentage of Population Employed in Security & Protection in Pennsylvania is 2.0%.
What is the Percentage of Population Employed in Security & Protection in the United States?
Percentage of Population Employed in Security & Protection in the United States is 2.1%.