Zip Codes with the Highest Percentage of Population Employed in Transportation & Warehousing in Pennsylvania
RELATED REPORTS & OPTIONS
Transportation & Warehousing
Pennsylvania
Compare Zip Codes
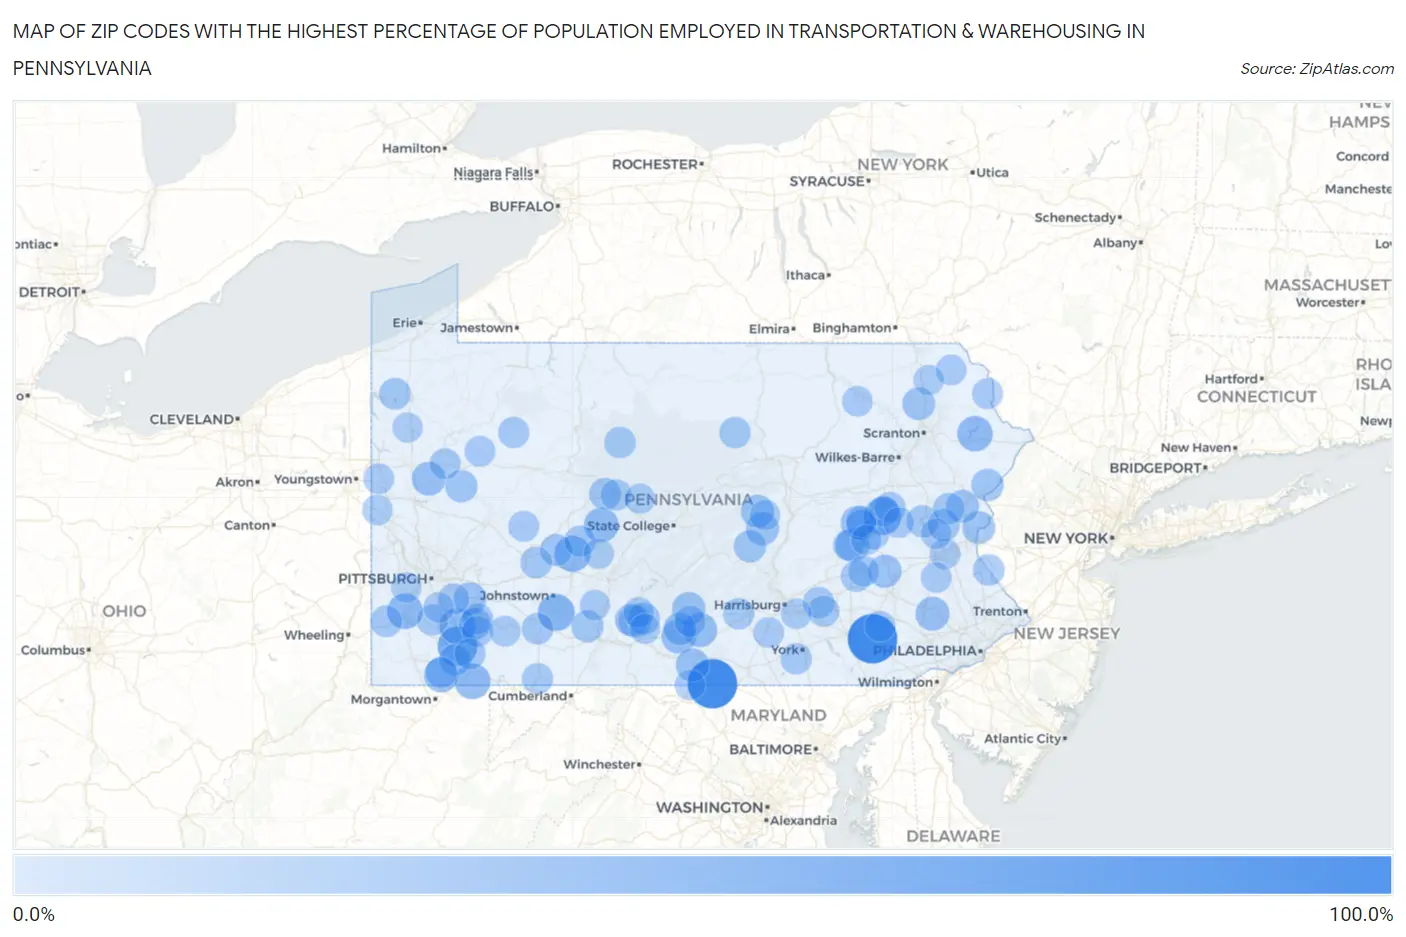
Map of Zip Codes with the Highest Percentage of Population Employed in Transportation & Warehousing in Pennsylvania
0.0%
100.0%
Zip Codes with the Highest Percentage of Population Employed in Transportation & Warehousing in Pennsylvania
| Zip Code | % Employed | vs State | vs National | |
| 1. | 17250 | 100.0% | 5.0%(+95.0)#1 | 4.9%(+95.1)#5 |
| 2. | 17534 | 100.0% | 5.0%(+95.0)#2 | 4.9%(+95.1)#13 |
| 3. | 15488 | 54.5% | 5.0%(+49.6)#3 | 4.9%(+49.6)#64 |
| 4. | 18245 | 45.2% | 5.0%(+40.2)#4 | 4.9%(+40.3)#102 |
| 5. | 15953 | 42.3% | 5.0%(+37.3)#5 | 4.9%(+37.3)#115 |
| 6. | 15737 | 39.6% | 5.0%(+34.6)#6 | 4.9%(+34.7)#130 |
| 7. | 15492 | 39.0% | 5.0%(+34.0)#7 | 4.9%(+34.1)#135 |
| 8. | 15440 | 37.9% | 5.0%(+32.9)#8 | 4.9%(+33.0)#147 |
| 9. | 15347 | 36.7% | 5.0%(+31.7)#9 | 4.9%(+31.7)#156 |
| 10. | 18451 | 35.6% | 5.0%(+30.6)#10 | 4.9%(+30.7)#164 |
| 11. | 16645 | 32.5% | 5.0%(+27.5)#11 | 4.9%(+27.5)#194 |
| 12. | 15467 | 32.1% | 5.0%(+27.2)#12 | 4.9%(+27.2)#199 |
| 13. | 17221 | 31.4% | 5.0%(+26.4)#13 | 4.9%(+26.5)#209 |
| 14. | 17232 | 30.8% | 5.0%(+25.8)#14 | 4.9%(+25.8)#214 |
| 15. | 17944 | 29.2% | 5.0%(+24.3)#15 | 4.9%(+24.3)#244 |
| 16. | 19457 | 29.1% | 5.0%(+24.1)#16 | 4.9%(+24.2)#246 |
| 17. | 16035 | 28.7% | 5.0%(+23.8)#17 | 4.9%(+23.8)#252 |
| 18. | 17946 | 27.2% | 5.0%(+22.2)#18 | 4.9%(+22.3)#288 |
| 19. | 17217 | 26.4% | 5.0%(+21.4)#19 | 4.9%(+21.4)#300 |
| 20. | 17235 | 26.3% | 5.0%(+21.3)#20 | 4.9%(+21.4)#302 |
| 21. | 19516 | 25.6% | 5.0%(+20.6)#21 | 4.9%(+20.6)#322 |
| 22. | 17861 | 25.0% | 5.0%(+20.0)#22 | 4.9%(+20.1)#332 |
| 23. | 17880 | 25.0% | 5.0%(+20.0)#23 | 4.9%(+20.1)#334 |
| 24. | 15611 | 24.3% | 5.0%(+19.3)#24 | 4.9%(+19.4)#350 |
| 25. | 16679 | 24.2% | 5.0%(+19.2)#25 | 4.9%(+19.2)#356 |
| 26. | 18063 | 24.1% | 5.0%(+19.1)#26 | 4.9%(+19.2)#359 |
| 27. | 18420 | 24.1% | 5.0%(+19.1)#27 | 4.9%(+19.1)#363 |
| 28. | 18354 | 24.0% | 5.0%(+19.0)#28 | 4.9%(+19.1)#366 |
| 29. | 17271 | 23.9% | 5.0%(+18.9)#29 | 4.9%(+18.9)#369 |
| 30. | 18335 | 22.5% | 5.0%(+17.5)#30 | 4.9%(+17.6)#406 |
| 31. | 17014 | 22.5% | 5.0%(+17.5)#31 | 4.9%(+17.5)#411 |
| 32. | 16022 | 22.1% | 5.0%(+17.1)#32 | 4.9%(+17.2)#429 |
| 33. | 16633 | 22.1% | 5.0%(+17.1)#33 | 4.9%(+17.2)#433 |
| 34. | 16694 | 21.7% | 5.0%(+16.7)#34 | 4.9%(+16.8)#447 |
| 35. | 15761 | 21.0% | 5.0%(+16.0)#35 | 4.9%(+16.0)#480 |
| 36. | 15554 | 20.7% | 5.0%(+15.8)#36 | 4.9%(+15.8)#491 |
| 37. | 18244 | 20.7% | 5.0%(+15.7)#37 | 4.9%(+15.8)#493 |
| 38. | 15484 | 20.4% | 5.0%(+15.4)#38 | 4.9%(+15.5)#514 |
| 39. | 15612 | 20.1% | 5.0%(+15.1)#39 | 4.9%(+15.1)#534 |
| 40. | 18038 | 19.8% | 5.0%(+14.8)#40 | 4.9%(+14.9)#553 |
| 41. | 16422 | 19.7% | 5.0%(+14.7)#41 | 4.9%(+14.8)#557 |
| 42. | 16843 | 19.6% | 5.0%(+14.6)#42 | 4.9%(+14.6)#567 |
| 43. | 15720 | 19.0% | 5.0%(+14.1)#43 | 4.9%(+14.1)#591 |
| 44. | 15365 | 18.9% | 5.0%(+13.9)#44 | 4.9%(+13.9)#601 |
| 45. | 18920 | 18.4% | 5.0%(+13.4)#45 | 4.9%(+13.5)#648 |
| 46. | 15520 | 18.3% | 5.0%(+13.3)#46 | 4.9%(+13.3)#657 |
| 47. | 18331 | 18.2% | 5.0%(+13.3)#47 | 4.9%(+13.3)#658 |
| 48. | 17010 | 18.2% | 5.0%(+13.2)#48 | 4.9%(+13.2)#662 |
| 49. | 17776 | 18.2% | 5.0%(+13.2)#49 | 4.9%(+13.2)#666 |
| 50. | 15821 | 18.2% | 5.0%(+13.2)#50 | 4.9%(+13.2)#669 |
| 51. | 16675 | 17.4% | 5.0%(+12.4)#51 | 4.9%(+12.4)#731 |
| 52. | 15366 | 17.3% | 5.0%(+12.3)#52 | 4.9%(+12.4)#740 |
| 53. | 17371 | 17.3% | 5.0%(+12.3)#53 | 4.9%(+12.4)#741 |
| 54. | 15460 | 17.3% | 5.0%(+12.3)#54 | 4.9%(+12.4)#742 |
| 55. | 17081 | 17.2% | 5.0%(+12.3)#55 | 4.9%(+12.3)#751 |
| 56. | 19550 | 17.2% | 5.0%(+12.2)#56 | 4.9%(+12.2)#756 |
| 57. | 17923 | 17.2% | 5.0%(+12.2)#57 | 4.9%(+12.2)#757 |
| 58. | 17262 | 17.1% | 5.0%(+12.2)#58 | 4.9%(+12.2)#759 |
| 59. | 15688 | 16.9% | 5.0%(+11.9)#59 | 4.9%(+12.0)#778 |
| 60. | 18254 | 16.8% | 5.0%(+11.8)#60 | 4.9%(+11.8)#804 |
| 61. | 17041 | 16.7% | 5.0%(+11.7)#61 | 4.9%(+11.7)#821 |
| 62. | 15532 | 16.7% | 5.0%(+11.7)#62 | 4.9%(+11.7)#824 |
| 63. | 16855 | 16.7% | 5.0%(+11.7)#63 | 4.9%(+11.7)#827 |
| 64. | 15631 | 16.6% | 5.0%(+11.6)#64 | 4.9%(+11.7)#833 |
| 65. | 17953 | 16.3% | 5.0%(+11.3)#65 | 4.9%(+11.3)#866 |
| 66. | 15028 | 16.2% | 5.0%(+11.2)#66 | 4.9%(+11.3)#875 |
| 67. | 16220 | 16.1% | 5.0%(+11.1)#67 | 4.9%(+11.2)#891 |
| 68. | 16372 | 16.0% | 5.0%(+11.0)#68 | 4.9%(+11.1)#905 |
| 69. | 19559 | 16.0% | 5.0%(+11.0)#69 | 4.9%(+11.0)#914 |
| 70. | 15456 | 15.7% | 5.0%(+10.7)#70 | 4.9%(+10.8)#948 |
| 71. | 15646 | 15.5% | 5.0%(+10.5)#71 | 4.9%(+10.6)#968 |
| 72. | 18443 | 15.1% | 5.0%(+10.1)#72 | 4.9%(+10.2)#1,040 |
| 73. | 16246 | 15.1% | 5.0%(+10.1)#73 | 4.9%(+10.1)#1,053 |
| 74. | 18102 | 15.0% | 5.0%(+10.1)#74 | 4.9%(+10.1)#1,056 |
| 75. | 18237 | 15.0% | 5.0%(+10.0)#75 | 4.9%(+10.1)#1,063 |
| 76. | 16143 | 14.9% | 5.0%(+9.93)#76 | 4.9%(+9.98)#1,081 |
| 77. | 16331 | 14.7% | 5.0%(+9.75)#77 | 4.9%(+9.79)#1,117 |
| 78. | 17934 | 14.6% | 5.0%(+9.62)#78 | 4.9%(+9.66)#1,142 |
| 79. | 18056 | 14.5% | 5.0%(+9.53)#79 | 4.9%(+9.57)#1,162 |
| 80. | 17323 | 14.5% | 5.0%(+9.52)#80 | 4.9%(+9.57)#1,164 |
| 81. | 18250 | 14.4% | 5.0%(+9.42)#81 | 4.9%(+9.46)#1,181 |
| 82. | 17976 | 14.4% | 5.0%(+9.37)#82 | 4.9%(+9.41)#1,189 |
| 83. | 15038 | 14.3% | 5.0%(+9.29)#83 | 4.9%(+9.34)#1,208 |
| 84. | 18454 | 14.3% | 5.0%(+9.29)#84 | 4.9%(+9.34)#1,216 |
| 85. | 18086 | 14.2% | 5.0%(+9.20)#85 | 4.9%(+9.25)#1,241 |
| 86. | 18846 | 14.2% | 5.0%(+9.16)#86 | 4.9%(+9.21)#1,248 |
| 87. | 16634 | 14.1% | 5.0%(+9.14)#87 | 4.9%(+9.18)#1,258 |
| 88. | 17506 | 14.1% | 5.0%(+9.13)#88 | 4.9%(+9.17)#1,261 |
| 89. | 17034 | 14.0% | 5.0%(+9.03)#89 | 4.9%(+9.08)#1,279 |
| 90. | 17263 | 13.7% | 5.0%(+8.75)#90 | 4.9%(+8.79)#1,336 |
| 91. | 15082 | 13.7% | 5.0%(+8.68)#91 | 4.9%(+8.73)#1,352 |
| 92. | 17862 | 13.6% | 5.0%(+8.60)#92 | 4.9%(+8.65)#1,376 |
| 93. | 16151 | 13.5% | 5.0%(+8.52)#93 | 4.9%(+8.57)#1,387 |
| 94. | 18842 | 13.3% | 5.0%(+8.34)#94 | 4.9%(+8.39)#1,444 |
| 95. | 16655 | 13.3% | 5.0%(+8.31)#95 | 4.9%(+8.36)#1,451 |
| 96. | 16120 | 13.2% | 5.0%(+8.23)#96 | 4.9%(+8.28)#1,475 |
| 97. | 16879 | 13.2% | 5.0%(+8.20)#97 | 4.9%(+8.25)#1,488 |
| 98. | 17965 | 13.1% | 5.0%(+8.14)#98 | 4.9%(+8.18)#1,498 |
| 99. | 16636 | 13.0% | 5.0%(+7.99)#99 | 4.9%(+8.04)#1,537 |
| 100. | 16689 | 13.0% | 5.0%(+7.99)#100 | 4.9%(+8.03)#1,540 |
Common Questions
What are the Top 10 Zip Codes with the Highest Percentage of Population Employed in Transportation & Warehousing in Pennsylvania?
Top 10 Zip Codes with the Highest Percentage of Population Employed in Transportation & Warehousing in Pennsylvania are:
What zip code has the Highest Percentage of Population Employed in Transportation & Warehousing in Pennsylvania?
17250 has the Highest Percentage of Population Employed in Transportation & Warehousing in Pennsylvania with 100.0%.
What is the Percentage of Population Employed in Transportation & Warehousing in the State of Pennsylvania?
Percentage of Population Employed in Transportation & Warehousing in Pennsylvania is 5.0%.
What is the Percentage of Population Employed in Transportation & Warehousing in the United States?
Percentage of Population Employed in Transportation & Warehousing in the United States is 4.9%.