Zip Codes with the Highest Percentage of Population with a Degree in Physical and Health Sciences in Pennsylvania
RELATED REPORTS & OPTIONS
Physical and Health Sciences
Pennsylvania
Compare Zip Codes
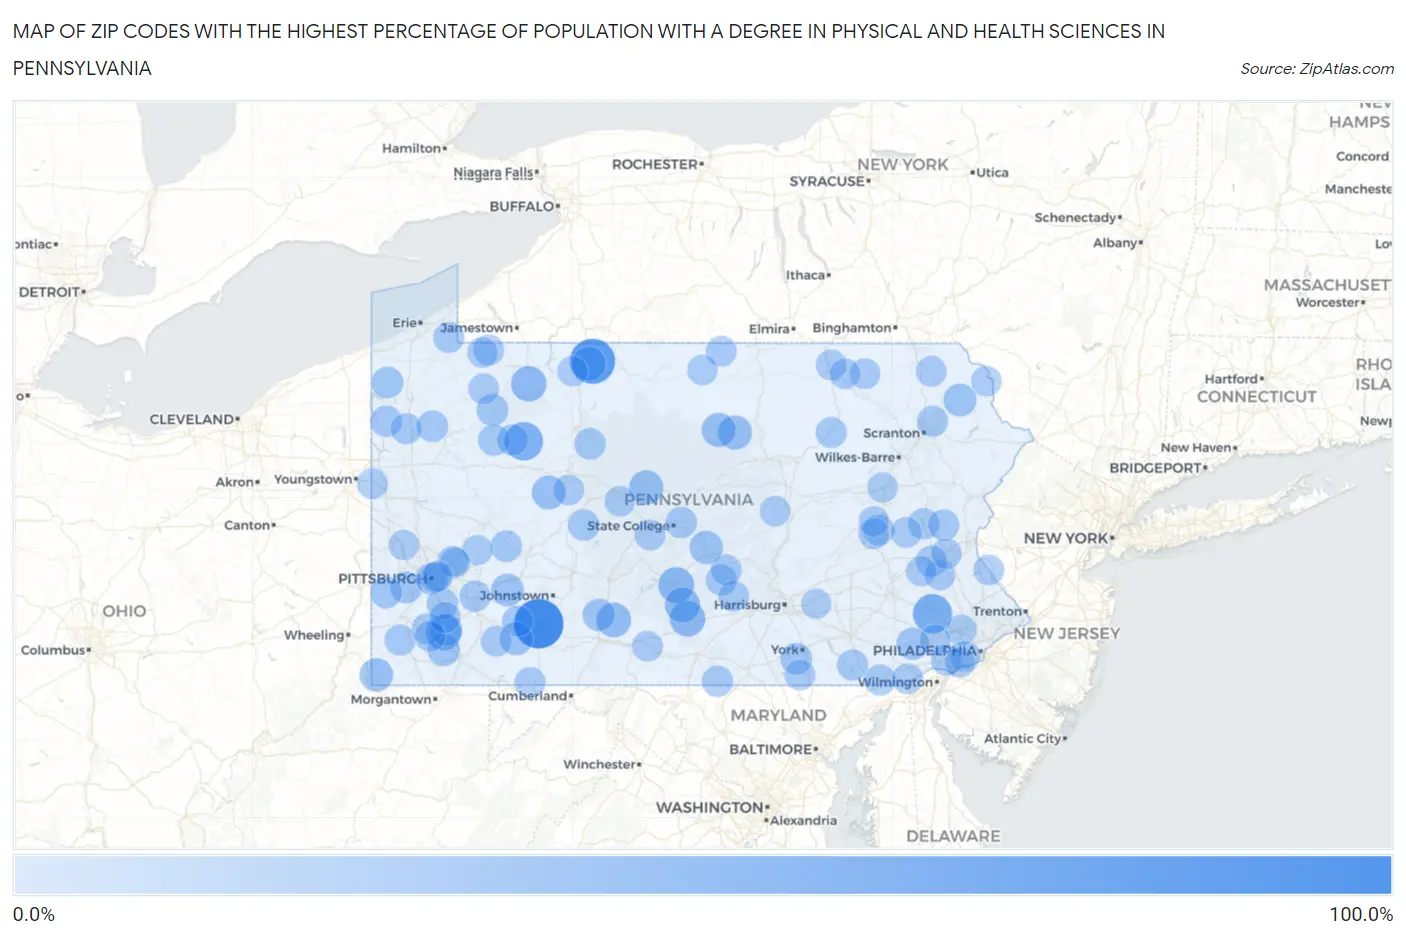
Map of Zip Codes with the Highest Percentage of Population with a Degree in Physical and Health Sciences in Pennsylvania
0.0%
100.0%
Zip Codes with the Highest Percentage of Population with a Degree in Physical and Health Sciences in Pennsylvania
| Zip Code | % Graduates | vs State | vs National | |
| 1. | 15546 | 100.0% | 3.3%(+96.7)#1 | 3.1%(+96.9)#3 |
| 2. | 16744 | 78.6% | 3.3%(+75.3)#2 | 3.1%(+75.5)#26 |
| 3. | 19457 | 50.0% | 3.3%(+46.7)#3 | 3.1%(+46.9)#63 |
| 4. | 16217 | 46.2% | 3.3%(+42.9)#4 | 3.1%(+43.1)#88 |
| 5. | 17075 | 33.3% | 3.3%(+30.1)#5 | 3.1%(+30.2)#151 |
| 6. | 17220 | 32.6% | 3.3%(+29.3)#6 | 3.1%(+29.5)#160 |
| 7. | 15434 | 32.6% | 3.3%(+29.3)#7 | 3.1%(+29.5)#161 |
| 8. | 16313 | 30.9% | 3.3%(+27.7)#8 | 3.1%(+27.8)#184 |
| 9. | 17213 | 30.4% | 3.3%(+27.2)#9 | 3.1%(+27.3)#189 |
| 10. | 16659 | 28.6% | 3.3%(+25.3)#10 | 3.1%(+25.5)#206 |
| 11. | 16834 | 26.6% | 3.3%(+23.4)#11 | 3.1%(+23.5)#240 |
| 12. | 16732 | 26.1% | 3.3%(+22.8)#12 | 3.1%(+23.0)#250 |
| 13. | 17776 | 25.0% | 3.3%(+21.7)#13 | 3.1%(+21.9)#276 |
| 14. | 17723 | 25.0% | 3.3%(+21.7)#14 | 3.1%(+21.9)#282 |
| 15. | 15711 | 24.1% | 3.3%(+20.9)#15 | 3.1%(+21.0)#292 |
| 16. | 15310 | 22.2% | 3.3%(+18.9)#16 | 3.1%(+19.1)#340 |
| 17. | 17099 | 21.3% | 3.3%(+18.0)#17 | 3.1%(+18.2)#365 |
| 18. | 15502 | 21.0% | 3.3%(+17.7)#18 | 3.1%(+17.9)#378 |
| 19. | 18456 | 19.7% | 3.3%(+16.5)#19 | 3.1%(+16.6)#416 |
| 20. | 15671 | 18.9% | 3.3%(+15.6)#20 | 3.1%(+15.8)#451 |
| 21. | 19372 | 17.2% | 3.3%(+13.9)#21 | 3.1%(+14.1)#538 |
| 22. | 16667 | 17.0% | 3.3%(+13.8)#22 | 3.1%(+13.9)#542 |
| 23. | 15475 | 16.5% | 3.3%(+13.2)#23 | 3.1%(+13.4)#579 |
| 24. | 15082 | 15.3% | 3.3%(+12.0)#24 | 3.1%(+12.2)#651 |
| 25. | 16370 | 15.2% | 3.3%(+11.9)#25 | 3.1%(+12.1)#662 |
| 26. | 15412 | 15.2% | 3.3%(+11.9)#26 | 3.1%(+12.1)#663 |
| 27. | 17371 | 14.3% | 3.3%(+11.0)#27 | 3.1%(+11.2)#737 |
| 28. | 16406 | 14.2% | 3.3%(+10.9)#28 | 3.1%(+11.1)#751 |
| 29. | 15004 | 13.8% | 3.3%(+10.6)#29 | 3.1%(+10.7)#779 |
| 30. | 15282 | 13.7% | 3.3%(+10.4)#30 | 3.1%(+10.6)#797 |
| 31. | 16362 | 13.6% | 3.3%(+10.3)#31 | 3.1%(+10.5)#815 |
| 32. | 15846 | 13.5% | 3.3%(+10.3)#32 | 3.1%(+10.4)#820 |
| 33. | 15774 | 13.5% | 3.3%(+10.2)#33 | 3.1%(+10.4)#827 |
| 34. | 16326 | 13.2% | 3.3%(+9.96)#34 | 3.1%(+10.1)#846 |
| 35. | 15088 | 13.0% | 3.3%(+9.77)#35 | 3.1%(+9.94)#868 |
| 36. | 16110 | 13.0% | 3.3%(+9.77)#36 | 3.1%(+9.94)#870 |
| 37. | 16851 | 13.0% | 3.3%(+9.76)#37 | 3.1%(+9.93)#874 |
| 38. | 15753 | 12.9% | 3.3%(+9.63)#38 | 3.1%(+9.80)#889 |
| 39. | 18030 | 12.2% | 3.3%(+8.92)#39 | 3.1%(+9.10)#985 |
| 40. | 17214 | 12.0% | 3.3%(+8.70)#40 | 3.1%(+8.88)#1,006 |
| 41. | 15331 | 11.9% | 3.3%(+8.63)#41 | 3.1%(+8.81)#1,015 |
| 42. | 17037 | 11.8% | 3.3%(+8.49)#42 | 3.1%(+8.66)#1,038 |
| 43. | 15329 | 11.5% | 3.3%(+8.21)#43 | 3.1%(+8.39)#1,078 |
| 44. | 16233 | 11.5% | 3.3%(+8.21)#44 | 3.1%(+8.39)#1,079 |
| 45. | 19362 | 11.3% | 3.3%(+8.06)#45 | 3.1%(+8.24)#1,099 |
| 46. | 15033 | 11.3% | 3.3%(+8.06)#46 | 3.1%(+8.24)#1,104 |
| 47. | 18038 | 11.3% | 3.3%(+8.03)#47 | 3.1%(+8.20)#1,107 |
| 48. | 15634 | 11.2% | 3.3%(+7.96)#48 | 3.1%(+8.14)#1,117 |
| 49. | 18087 | 11.0% | 3.3%(+7.68)#49 | 3.1%(+7.86)#1,172 |
| 50. | 16130 | 10.9% | 3.3%(+7.65)#50 | 3.1%(+7.83)#1,179 |
| 51. | 16442 | 10.8% | 3.3%(+7.49)#51 | 3.1%(+7.67)#1,207 |
| 52. | 15677 | 10.7% | 3.3%(+7.44)#52 | 3.1%(+7.61)#1,221 |
| 53. | 17952 | 10.7% | 3.3%(+7.44)#53 | 3.1%(+7.61)#1,222 |
| 54. | 18626 | 10.6% | 3.3%(+7.34)#54 | 3.1%(+7.51)#1,237 |
| 55. | 18452 | 10.6% | 3.3%(+7.30)#55 | 3.1%(+7.48)#1,247 |
| 56. | 17532 | 10.5% | 3.3%(+7.25)#56 | 3.1%(+7.43)#1,253 |
| 57. | 15562 | 10.4% | 3.3%(+7.16)#57 | 3.1%(+7.34)#1,270 |
| 58. | 16420 | 10.3% | 3.3%(+6.98)#58 | 3.1%(+7.16)#1,310 |
| 59. | 16402 | 10.1% | 3.3%(+6.85)#59 | 3.1%(+7.03)#1,335 |
| 60. | 17082 | 10.1% | 3.3%(+6.83)#60 | 3.1%(+7.01)#1,338 |
| 61. | 18850 | 10.1% | 3.3%(+6.78)#61 | 3.1%(+6.96)#1,349 |
| 62. | 16877 | 10.0% | 3.3%(+6.76)#62 | 3.1%(+6.93)#1,353 |
| 63. | 19405 | 10.0% | 3.3%(+6.73)#63 | 3.1%(+6.91)#1,354 |
| 64. | 15866 | 10.0% | 3.3%(+6.72)#64 | 3.1%(+6.90)#1,370 |
| 65. | 19017 | 9.9% | 3.3%(+6.63)#65 | 3.1%(+6.81)#1,392 |
| 66. | 15469 | 9.9% | 3.3%(+6.60)#66 | 3.1%(+6.78)#1,399 |
| 67. | 17228 | 9.8% | 3.3%(+6.57)#67 | 3.1%(+6.75)#1,407 |
| 68. | 17327 | 9.7% | 3.3%(+6.46)#68 | 3.1%(+6.64)#1,426 |
| 69. | 15358 | 9.7% | 3.3%(+6.45)#69 | 3.1%(+6.63)#1,427 |
| 70. | 18211 | 9.7% | 3.3%(+6.42)#70 | 3.1%(+6.60)#1,441 |
| 71. | 19350 | 9.7% | 3.3%(+6.41)#71 | 3.1%(+6.59)#1,442 |
| 72. | 17953 | 9.7% | 3.3%(+6.40)#72 | 3.1%(+6.58)#1,447 |
| 73. | 18825 | 9.7% | 3.3%(+6.40)#73 | 3.1%(+6.58)#1,449 |
| 74. | 16928 | 9.6% | 3.3%(+6.35)#74 | 3.1%(+6.53)#1,464 |
| 75. | 17040 | 9.6% | 3.3%(+6.28)#75 | 3.1%(+6.46)#1,477 |
| 76. | 15049 | 9.5% | 3.3%(+6.22)#76 | 3.1%(+6.40)#1,495 |
| 77. | 16878 | 9.4% | 3.3%(+6.17)#77 | 3.1%(+6.35)#1,512 |
| 78. | 16155 | 9.3% | 3.3%(+6.00)#78 | 3.1%(+6.18)#1,559 |
| 79. | 18845 | 9.3% | 3.3%(+5.98)#79 | 3.1%(+6.16)#1,568 |
| 80. | 15213 | 9.1% | 3.3%(+5.86)#80 | 3.1%(+6.04)#1,611 |
| 81. | 18854 | 9.1% | 3.3%(+5.81)#81 | 3.1%(+5.99)#1,620 |
| 82. | 18920 | 9.1% | 3.3%(+5.81)#82 | 3.1%(+5.99)#1,635 |
| 83. | 18092 | 9.0% | 3.3%(+5.74)#83 | 3.1%(+5.91)#1,656 |
| 84. | 16405 | 8.9% | 3.3%(+5.61)#84 | 3.1%(+5.79)#1,703 |
| 85. | 17855 | 8.9% | 3.3%(+5.60)#85 | 3.1%(+5.78)#1,710 |
| 86. | 18101 | 8.8% | 3.3%(+5.48)#86 | 3.1%(+5.66)#1,747 |
| 87. | 19345 | 8.7% | 3.3%(+5.42)#87 | 3.1%(+5.60)#1,768 |
| 88. | 19018 | 8.5% | 3.3%(+5.24)#88 | 3.1%(+5.42)#1,832 |
| 89. | 19539 | 8.3% | 3.3%(+5.06)#89 | 3.1%(+5.24)#1,882 |
| 90. | 16943 | 8.3% | 3.3%(+5.06)#90 | 3.1%(+5.23)#1,893 |
| 91. | 18415 | 8.3% | 3.3%(+4.98)#91 | 3.1%(+5.16)#1,916 |
| 92. | 16738 | 8.2% | 3.3%(+4.91)#92 | 3.1%(+5.09)#1,941 |
| 93. | 19094 | 8.1% | 3.3%(+4.84)#93 | 3.1%(+5.01)#1,972 |
| 94. | 15641 | 8.0% | 3.3%(+4.72)#94 | 3.1%(+4.90)#2,022 |
| 95. | 17033 | 7.9% | 3.3%(+4.64)#95 | 3.1%(+4.82)#2,050 |
| 96. | 15144 | 7.9% | 3.3%(+4.63)#96 | 3.1%(+4.81)#2,054 |
| 97. | 15232 | 7.9% | 3.3%(+4.58)#97 | 3.1%(+4.76)#2,070 |
| 98. | 18214 | 7.8% | 3.3%(+4.52)#98 | 3.1%(+4.70)#2,101 |
| 99. | 15027 | 7.7% | 3.3%(+4.45)#99 | 3.1%(+4.63)#2,125 |
| 100. | 18222 | 7.7% | 3.3%(+4.42)#100 | 3.1%(+4.60)#2,139 |
Common Questions
What are the Top 10 Zip Codes with the Highest Percentage of Population with a Degree in Physical and Health Sciences in Pennsylvania?
Top 10 Zip Codes with the Highest Percentage of Population with a Degree in Physical and Health Sciences in Pennsylvania are:
What zip code has the Highest Percentage of Population with a Degree in Physical and Health Sciences in Pennsylvania?
15546 has the Highest Percentage of Population with a Degree in Physical and Health Sciences in Pennsylvania with 100.0%.
What is the Percentage of Population with a Degree in Physical and Health Sciences in the State of Pennsylvania?
Percentage of Population with a Degree in Physical and Health Sciences in Pennsylvania is 3.3%.
What is the Percentage of Population with a Degree in Physical and Health Sciences in the United States?
Percentage of Population with a Degree in Physical and Health Sciences in the United States is 3.1%.