Zip Codes with the Highest Percentage of Population Employed in Security & Protection in Easton, PA
RELATED REPORTS & OPTIONS
Security & Protection
Easton
Compare Zip Codes
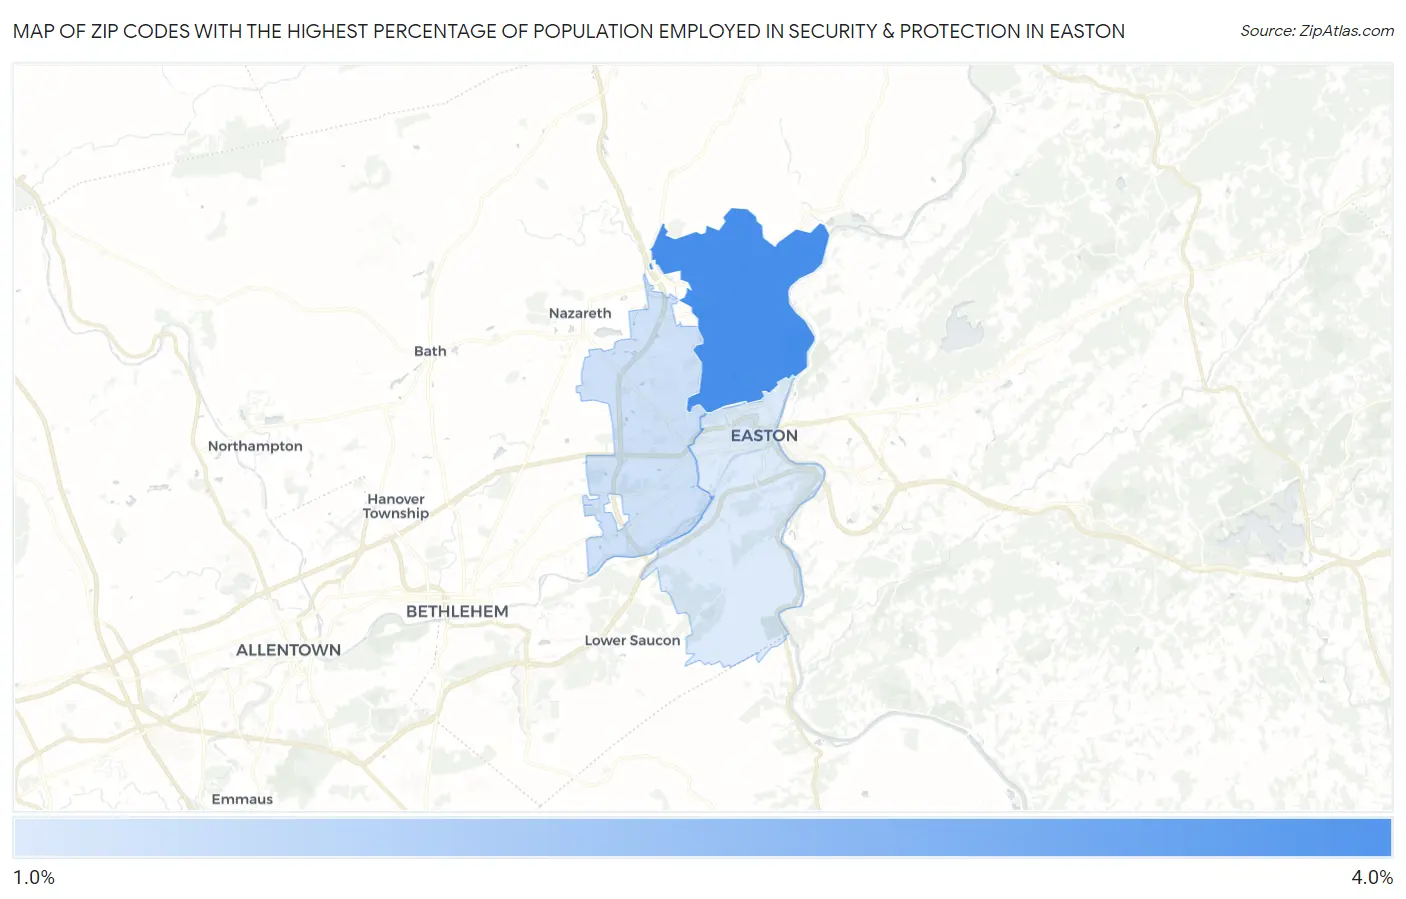
Map of Zip Codes with the Highest Percentage of Population Employed in Security & Protection in Easton
1.9%
3.2%
Zip Codes with the Highest Percentage of Population Employed in Security & Protection in Easton, PA
| Zip Code | % Employed | vs State | vs National | |
| 1. | 18040 | 3.2% | 2.0%(+1.15)#307 | 2.1%(+1.02)#6,638 |
| 2. | 18045 | 2.0% | 2.0%(-0.044)#632 | 2.1%(-0.173)#12,719 |
| 3. | 18042 | 1.9% | 2.0%(-0.162)#684 | 2.1%(-0.291)#13,502 |
1
Common Questions
What are the Top Zip Codes with the Highest Percentage of Population Employed in Security & Protection in Easton, PA?
Top Zip Codes with the Highest Percentage of Population Employed in Security & Protection in Easton, PA are:
What zip code has the Highest Percentage of Population Employed in Security & Protection in Easton, PA?
18040 has the Highest Percentage of Population Employed in Security & Protection in Easton, PA with 3.2%.
What is the Percentage of Population Employed in Security & Protection in Easton, PA?
Percentage of Population Employed in Security & Protection in Easton is 2.1%.
What is the Percentage of Population Employed in Security & Protection in Pennsylvania?
Percentage of Population Employed in Security & Protection in Pennsylvania is 2.0%.
What is the Percentage of Population Employed in Security & Protection in the United States?
Percentage of Population Employed in Security & Protection in the United States is 2.1%.