Zip Codes with the Highest Percentage of Population Employed in Security & Protection in Reading, PA
RELATED REPORTS & OPTIONS
Security & Protection
Reading
Compare Zip Codes
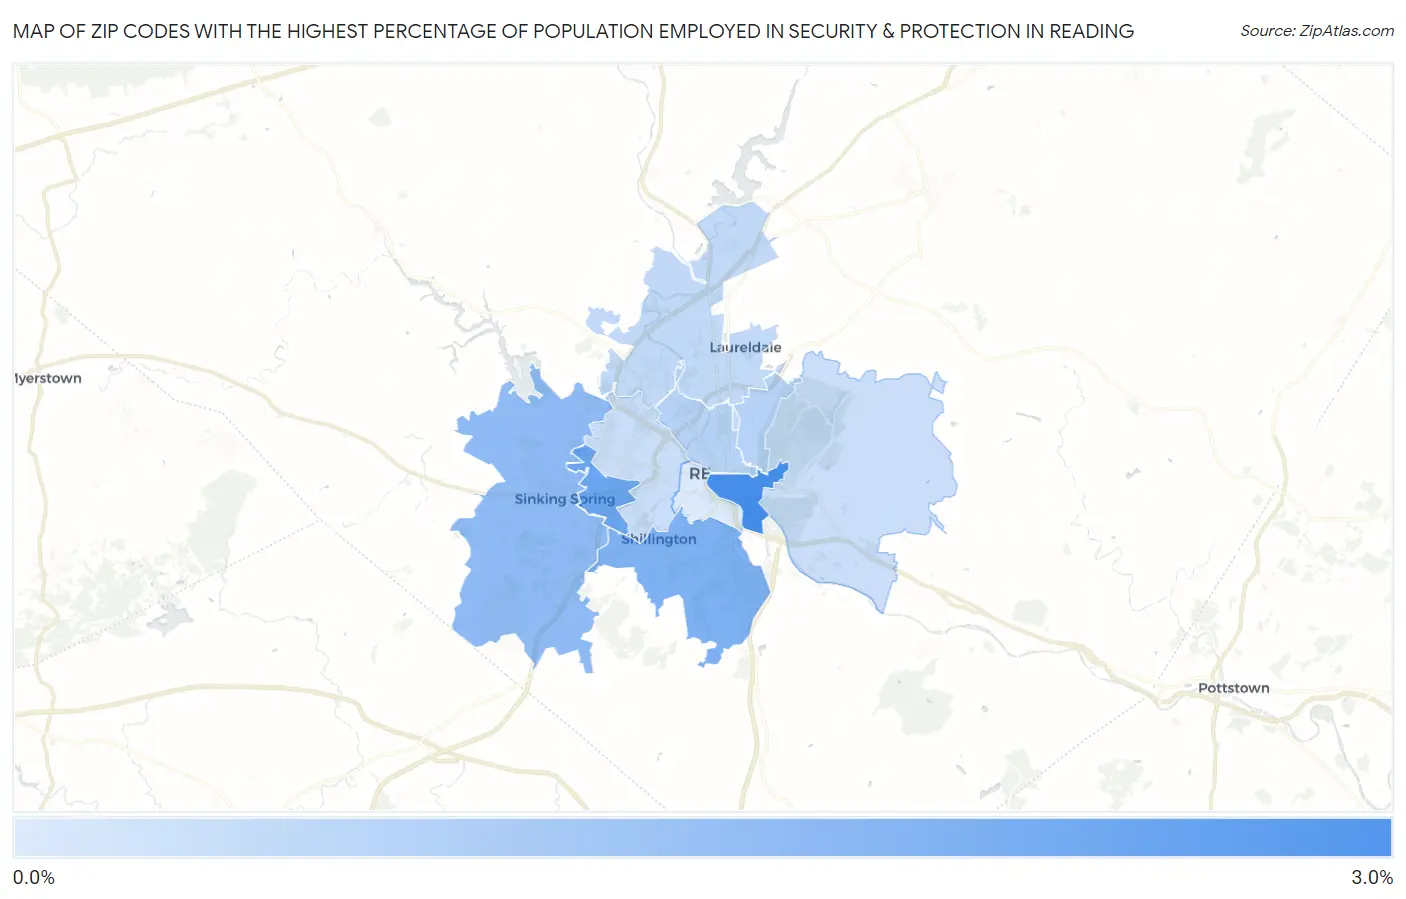
Map of Zip Codes with the Highest Percentage of Population Employed in Security & Protection in Reading
0.75%
3.0%
Zip Codes with the Highest Percentage of Population Employed in Security & Protection in Reading, PA
| Zip Code | % Employed | vs State | vs National | |
| 1. | 19602 | 3.0% | 2.0%(+0.949)#344 | 2.1%(+0.820)#7,349 |
| 2. | 19609 | 2.4% | 2.0%(+0.400)#473 | 2.1%(+0.271)#9,954 |
| 3. | 19607 | 2.2% | 2.0%(+0.134)#571 | 2.1%(+0.005)#11,546 |
| 4. | 19608 | 1.9% | 2.0%(-0.119)#661 | 2.1%(-0.248)#13,219 |
| 5. | 19604 | 1.3% | 2.0%(-0.688)#900 | 2.1%(-0.816)#17,483 |
| 6. | 19601 | 1.3% | 2.0%(-0.692)#901 | 2.1%(-0.821)#17,512 |
| 7. | 19605 | 1.2% | 2.0%(-0.850)#970 | 2.1%(-0.978)#18,745 |
| 8. | 19606 | 1.0% | 2.0%(-0.987)#1,027 | 2.1%(-1.12)#19,792 |
| 9. | 19610 | 1.0% | 2.0%(-1.02)#1,046 | 2.1%(-1.15)#20,014 |
| 10. | 19611 | 0.75% | 2.0%(-1.27)#1,146 | 2.1%(-1.40)#21,753 |
1
Common Questions
What are the Top 5 Zip Codes with the Highest Percentage of Population Employed in Security & Protection in Reading, PA?
Top 5 Zip Codes with the Highest Percentage of Population Employed in Security & Protection in Reading, PA are:
What zip code has the Highest Percentage of Population Employed in Security & Protection in Reading, PA?
19602 has the Highest Percentage of Population Employed in Security & Protection in Reading, PA with 3.0%.
What is the Percentage of Population Employed in Security & Protection in Reading, PA?
Percentage of Population Employed in Security & Protection in Reading is 1.6%.
What is the Percentage of Population Employed in Security & Protection in Pennsylvania?
Percentage of Population Employed in Security & Protection in Pennsylvania is 2.0%.
What is the Percentage of Population Employed in Security & Protection in the United States?
Percentage of Population Employed in Security & Protection in the United States is 2.1%.