Zip Codes with the Highest Percentage of Guamanian / Chamorro Population in Pennsylvania
RELATED REPORTS & OPTIONS
Guamanian / Chamorro
Pennsylvania
Compare Zip Codes
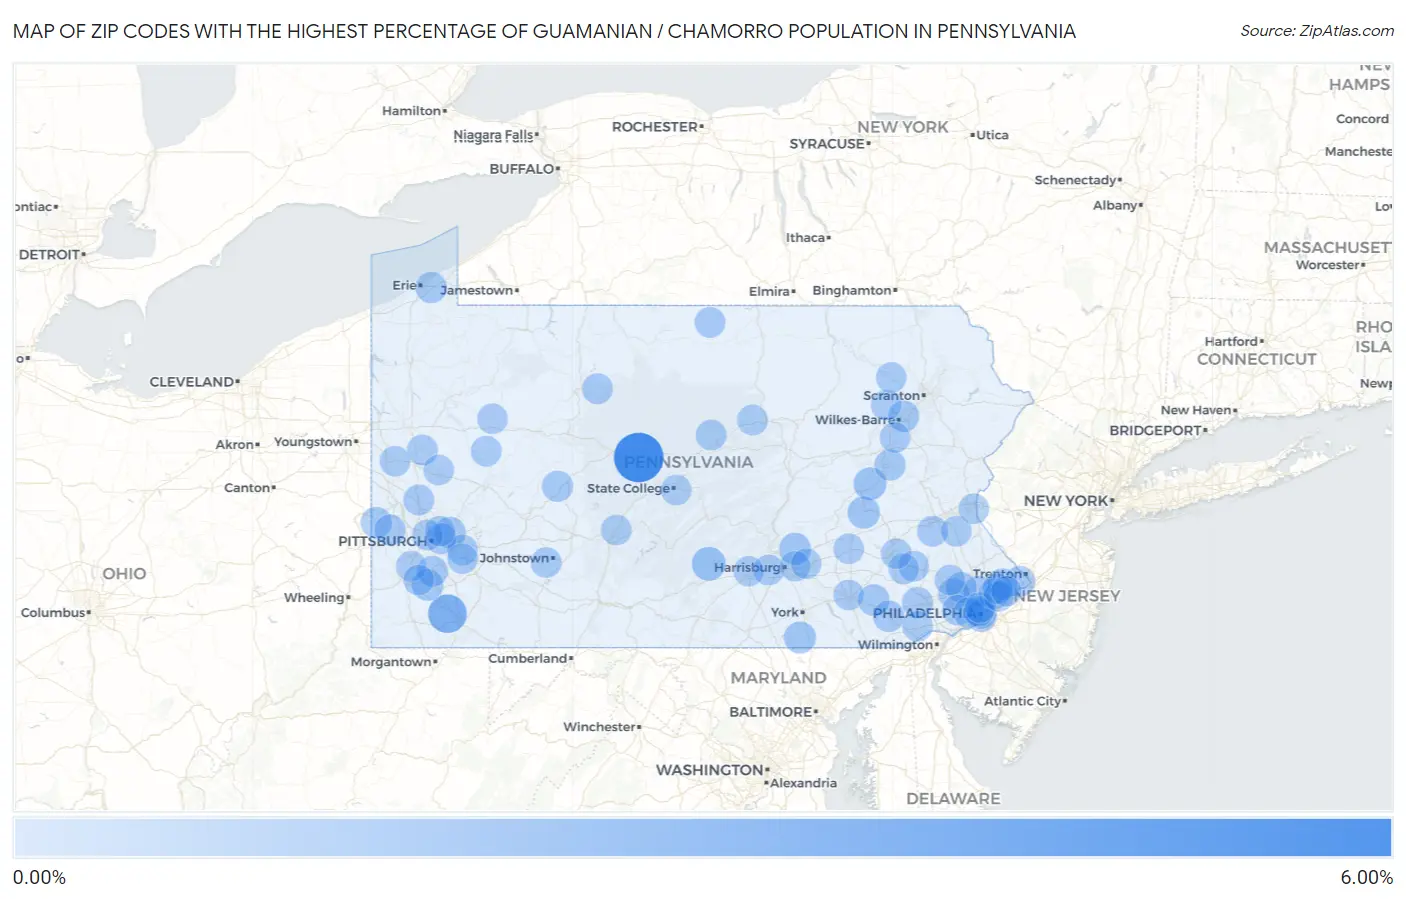
Map of Zip Codes with the Highest Percentage of Guamanian / Chamorro Population in Pennsylvania
0.00%
6.00%
Zip Codes with the Highest Percentage of Guamanian / Chamorro Population in Pennsylvania
| Zip Code | Guamanian / Chamorro | vs State | vs National | |
| 1. | 16847 | 5.16% | 0.0098%(+5.15)#1 | 0.047%(+5.12)#10 |
| 2. | 15468 | 2.19% | 0.0098%(+2.18)#2 | 0.047%(+2.14)#43 |
| 3. | 17006 | 0.88% | 0.0098%(+0.873)#3 | 0.047%(+0.836)#196 |
| 4. | 17948 | 0.61% | 0.0098%(+0.599)#4 | 0.047%(+0.562)#327 |
| 5. | 17929 | 0.51% | 0.0098%(+0.500)#5 | 0.047%(+0.464)#413 |
| 6. | 17327 | 0.41% | 0.0098%(+0.401)#6 | 0.047%(+0.364)#507 |
| 7. | 17112 | 0.38% | 0.0098%(+0.371)#7 | 0.047%(+0.334)#551 |
| 8. | 17529 | 0.29% | 0.0098%(+0.282)#8 | 0.047%(+0.245)#718 |
| 9. | 15314 | 0.28% | 0.0098%(+0.274)#9 | 0.047%(+0.237)#746 |
| 10. | 16563 | 0.26% | 0.0098%(+0.249)#10 | 0.047%(+0.213)#822 |
| 11. | 15147 | 0.26% | 0.0098%(+0.248)#11 | 0.047%(+0.211)#829 |
| 12. | 19310 | 0.23% | 0.0098%(+0.223)#12 | 0.047%(+0.186)#909 |
| 13. | 15043 | 0.23% | 0.0098%(+0.217)#13 | 0.047%(+0.180)#926 |
| 14. | 18705 | 0.21% | 0.0098%(+0.198)#14 | 0.047%(+0.161)#1,001 |
| 15. | 15026 | 0.20% | 0.0098%(+0.195)#15 | 0.047%(+0.158)#1,011 |
| 16. | 18201 | 0.20% | 0.0098%(+0.193)#16 | 0.047%(+0.157)#1,019 |
| 17. | 19147 | 0.20% | 0.0098%(+0.192)#17 | 0.047%(+0.156)#1,024 |
| 18. | 15742 | 0.19% | 0.0098%(+0.182)#18 | 0.047%(+0.146)#1,071 |
| 19. | 19406 | 0.16% | 0.0098%(+0.150)#19 | 0.047%(+0.113)#1,243 |
| 20. | 19335 | 0.16% | 0.0098%(+0.149)#20 | 0.047%(+0.112)#1,250 |
| 21. | 16066 | 0.13% | 0.0098%(+0.120)#21 | 0.047%(+0.083)#1,422 |
| 22. | 15085 | 0.13% | 0.0098%(+0.116)#22 | 0.047%(+0.079)#1,455 |
| 23. | 19038 | 0.12% | 0.0098%(+0.110)#23 | 0.047%(+0.073)#1,505 |
| 24. | 19401 | 0.12% | 0.0098%(+0.109)#24 | 0.047%(+0.072)#1,510 |
| 25. | 15332 | 0.12% | 0.0098%(+0.106)#25 | 0.047%(+0.070)#1,535 |
| 26. | 17744 | 0.10% | 0.0098%(+0.095)#26 | 0.047%(+0.058)#1,631 |
| 27. | 15208 | 0.100% | 0.0098%(+0.090)#27 | 0.047%(+0.053)#1,683 |
| 28. | 17751 | 0.097% | 0.0098%(+0.088)#28 | 0.047%(+0.051)#1,701 |
| 29. | 18062 | 0.094% | 0.0098%(+0.084)#29 | 0.047%(+0.047)#1,745 |
| 30. | 15214 | 0.088% | 0.0098%(+0.078)#30 | 0.047%(+0.042)#1,799 |
| 31. | 17050 | 0.088% | 0.0098%(+0.078)#31 | 0.047%(+0.042)#1,801 |
| 32. | 19518 | 0.073% | 0.0098%(+0.063)#32 | 0.047%(+0.026)#1,957 |
| 33. | 15857 | 0.069% | 0.0098%(+0.060)#33 | 0.047%(+0.023)#1,990 |
| 34. | 19054 | 0.069% | 0.0098%(+0.059)#34 | 0.047%(+0.022)#2,004 |
| 35. | 19008 | 0.068% | 0.0098%(+0.058)#35 | 0.047%(+0.022)#2,008 |
| 36. | 16057 | 0.066% | 0.0098%(+0.057)#36 | 0.047%(+0.020)#2,033 |
| 37. | 16248 | 0.064% | 0.0098%(+0.054)#37 | 0.047%(+0.017)#2,067 |
| 38. | 16950 | 0.062% | 0.0098%(+0.052)#38 | 0.047%(+0.016)#2,083 |
| 39. | 18036 | 0.062% | 0.0098%(+0.052)#39 | 0.047%(+0.015)#2,086 |
| 40. | 18707 | 0.061% | 0.0098%(+0.051)#40 | 0.047%(+0.015)#2,096 |
| 41. | 19508 | 0.052% | 0.0098%(+0.042)#41 | 0.047%(+0.005)#2,216 |
| 42. | 18612 | 0.050% | 0.0098%(+0.040)#42 | 0.047%(+0.003)#2,246 |
| 43. | 19053 | 0.046% | 0.0098%(+0.036)#43 | 0.047%(-0.001)#2,318 |
| 44. | 19107 | 0.046% | 0.0098%(+0.036)#44 | 0.047%(-0.001)#2,320 |
| 45. | 18657 | 0.045% | 0.0098%(+0.035)#45 | 0.047%(-0.001)#2,333 |
| 46. | 19082 | 0.044% | 0.0098%(+0.035)#46 | 0.047%(-0.002)#2,346 |
| 47. | 16602 | 0.043% | 0.0098%(+0.033)#47 | 0.047%(-0.003)#2,366 |
| 48. | 19348 | 0.042% | 0.0098%(+0.032)#48 | 0.047%(-0.004)#2,378 |
| 49. | 17013 | 0.041% | 0.0098%(+0.031)#49 | 0.047%(-0.006)#2,403 |
| 50. | 15642 | 0.038% | 0.0098%(+0.029)#50 | 0.047%(-0.008)#2,443 |
| 51. | 15905 | 0.035% | 0.0098%(+0.025)#51 | 0.047%(-0.011)#2,506 |
| 52. | 19115 | 0.034% | 0.0098%(+0.024)#52 | 0.047%(-0.012)#2,541 |
| 53. | 15317 | 0.032% | 0.0098%(+0.022)#53 | 0.047%(-0.014)#2,574 |
| 54. | 17067 | 0.031% | 0.0098%(+0.021)#54 | 0.047%(-0.016)#2,602 |
| 55. | 16254 | 0.028% | 0.0098%(+0.018)#55 | 0.047%(-0.018)#2,655 |
| 56. | 19426 | 0.028% | 0.0098%(+0.018)#56 | 0.047%(-0.018)#2,656 |
| 57. | 16801 | 0.028% | 0.0098%(+0.018)#57 | 0.047%(-0.019)#2,665 |
| 58. | 16001 | 0.028% | 0.0098%(+0.018)#58 | 0.047%(-0.019)#2,668 |
| 59. | 19130 | 0.026% | 0.0098%(+0.017)#59 | 0.047%(-0.020)#2,705 |
| 60. | 19604 | 0.026% | 0.0098%(+0.016)#60 | 0.047%(-0.020)#2,712 |
| 61. | 19132 | 0.025% | 0.0098%(+0.015)#61 | 0.047%(-0.022)#2,735 |
| 62. | 15215 | 0.024% | 0.0098%(+0.014)#62 | 0.047%(-0.023)#2,757 |
| 63. | 16101 | 0.023% | 0.0098%(+0.013)#63 | 0.047%(-0.024)#2,782 |
| 64. | 19114 | 0.019% | 0.0098%(+0.009)#64 | 0.047%(-0.028)#2,850 |
| 65. | 15330 | 0.018% | 0.0098%(+0.008)#65 | 0.047%(-0.028)#2,874 |
| 66. | 18042 | 0.016% | 0.0098%(+0.006)#66 | 0.047%(-0.031)#2,925 |
| 67. | 17601 | 0.012% | 0.0098%(+0.003)#67 | 0.047%(-0.034)#2,984 |
| 68. | 17111 | 0.011% | 0.0098%(+0.001)#68 | 0.047%(-0.036)#3,014 |
| 69. | 17036 | 0.0090% | 0.0098%(-0.001)#69 | 0.047%(-0.038)#3,049 |
| 70. | 19116 | 0.0089% | 0.0098%(-0.001)#70 | 0.047%(-0.038)#3,051 |
| 71. | 19020 | 0.0088% | 0.0098%(-0.001)#71 | 0.047%(-0.038)#3,053 |
Common Questions
What are the Top 10 Zip Codes with the Highest Percentage of Guamanian / Chamorro Population in Pennsylvania?
Top 10 Zip Codes with the Highest Percentage of Guamanian / Chamorro Population in Pennsylvania are:
What zip code has the Highest Percentage of Guamanian / Chamorro Population in Pennsylvania?
16847 has the Highest Percentage of Guamanian / Chamorro Population in Pennsylvania with 5.16%.
What is the Percentage of Guamanian / Chamorro Population in the State of Pennsylvania?
Percentage of Guamanian / Chamorro Population in Pennsylvania is 0.0098%.
What is the Percentage of Guamanian / Chamorro Population in the United States?
Percentage of Guamanian / Chamorro Population in the United States is 0.047%.