Zip Codes with the Highest Percentage of Population Employed in Health Diagnosing & Treating in Pennsylvania
RELATED REPORTS & OPTIONS
Health Diagnosing & Treating
Pennsylvania
Compare Zip Codes
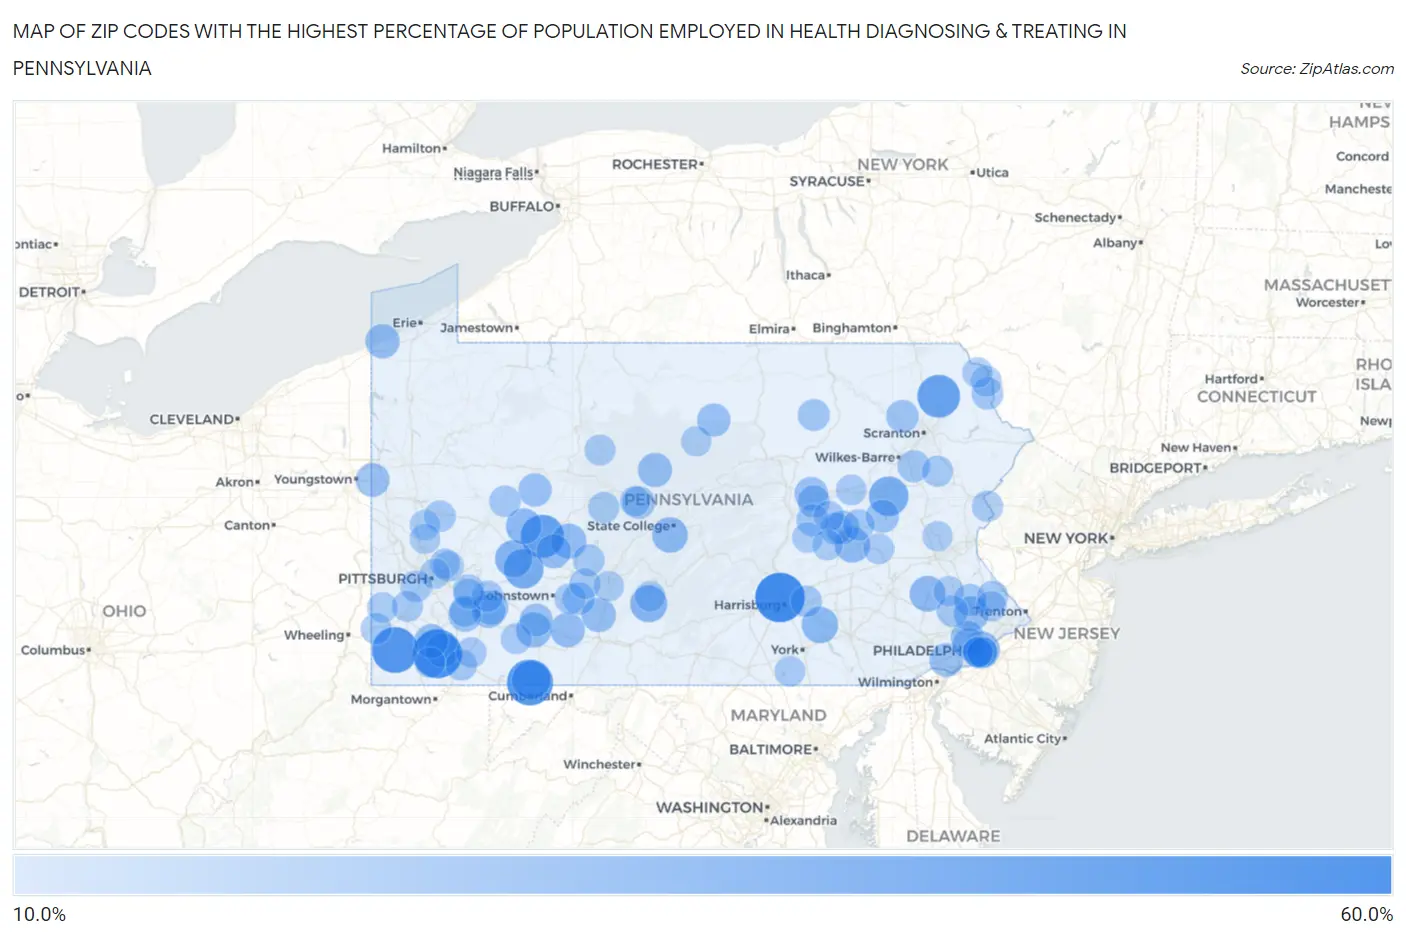
Map of Zip Codes with the Highest Percentage of Population Employed in Health Diagnosing & Treating in Pennsylvania
10.0%
60.0%
Zip Codes with the Highest Percentage of Population Employed in Health Diagnosing & Treating in Pennsylvania
| Zip Code | % Employed | vs State | vs National | |
| 1. | 17093 | 58.2% | 7.4%(+50.8)#1 | 6.2%(+51.9)#46 |
| 2. | 15447 | 57.0% | 7.4%(+49.6)#2 | 6.2%(+50.7)#48 |
| 3. | 15562 | 50.0% | 7.4%(+42.6)#3 | 6.2%(+43.8)#62 |
| 4. | 15353 | 50.0% | 7.4%(+42.6)#4 | 6.2%(+43.8)#67 |
| 5. | 15734 | 43.2% | 7.4%(+35.8)#5 | 6.2%(+36.9)#95 |
| 6. | 18413 | 42.3% | 7.4%(+35.0)#6 | 6.2%(+36.1)#102 |
| 7. | 15731 | 35.2% | 7.4%(+27.8)#7 | 6.2%(+28.9)#150 |
| 8. | 18234 | 34.5% | 7.4%(+27.2)#8 | 6.2%(+28.3)#154 |
| 9. | 15565 | 33.3% | 7.4%(+26.0)#9 | 6.2%(+27.1)#173 |
| 10. | 15713 | 29.7% | 7.4%(+22.3)#10 | 6.2%(+23.4)#228 |
| 11. | 19108 | 29.0% | 7.4%(+21.6)#11 | 6.2%(+22.7)#241 |
| 12. | 16685 | 29.0% | 7.4%(+21.6)#12 | 6.2%(+22.7)#242 |
| 13. | 17570 | 27.6% | 7.4%(+20.2)#13 | 6.2%(+21.3)#264 |
| 14. | 19545 | 26.1% | 7.4%(+18.8)#14 | 6.2%(+19.9)#285 |
| 15. | 16246 | 26.0% | 7.4%(+18.7)#15 | 6.2%(+19.8)#288 |
| 16. | 16868 | 26.0% | 7.4%(+18.7)#16 | 6.2%(+19.8)#289 |
| 17. | 17944 | 25.5% | 7.4%(+18.1)#17 | 6.2%(+19.2)#308 |
| 18. | 15738 | 25.0% | 7.4%(+17.6)#18 | 6.2%(+18.8)#328 |
| 19. | 15561 | 25.0% | 7.4%(+17.6)#19 | 6.2%(+18.8)#332 |
| 20. | 15924 | 23.7% | 7.4%(+16.4)#20 | 6.2%(+17.5)#367 |
| 21. | 19436 | 23.5% | 7.4%(+16.2)#21 | 6.2%(+17.3)#370 |
| 22. | 15463 | 23.2% | 7.4%(+15.8)#22 | 6.2%(+16.9)#383 |
| 23. | 15745 | 22.9% | 7.4%(+15.6)#23 | 6.2%(+16.7)#393 |
| 24. | 16845 | 22.8% | 7.4%(+15.4)#24 | 6.2%(+16.5)#398 |
| 25. | 16667 | 22.8% | 7.4%(+15.4)#25 | 6.2%(+16.5)#400 |
| 26. | 16430 | 22.7% | 7.4%(+15.4)#26 | 6.2%(+16.5)#401 |
| 27. | 15368 | 22.6% | 7.4%(+15.3)#27 | 6.2%(+16.4)#405 |
| 28. | 15676 | 22.4% | 7.4%(+15.0)#28 | 6.2%(+16.1)#416 |
| 29. | 17945 | 21.9% | 7.4%(+14.6)#29 | 6.2%(+15.7)#436 |
| 30. | 16140 | 21.6% | 7.4%(+14.3)#30 | 6.2%(+15.4)#452 |
| 31. | 19017 | 21.5% | 7.4%(+14.1)#31 | 6.2%(+15.3)#457 |
| 32. | 19102 | 21.4% | 7.4%(+14.1)#32 | 6.2%(+15.2)#461 |
| 33. | 17821 | 21.2% | 7.4%(+13.9)#33 | 6.2%(+15.0)#469 |
| 34. | 15689 | 21.2% | 7.4%(+13.9)#34 | 6.2%(+15.0)#471 |
| 35. | 15695 | 20.9% | 7.4%(+13.5)#35 | 6.2%(+14.7)#488 |
| 36. | 15730 | 20.9% | 7.4%(+13.5)#36 | 6.2%(+14.7)#489 |
| 37. | 19035 | 20.8% | 7.4%(+13.5)#37 | 6.2%(+14.6)#493 |
| 38. | 17769 | 20.7% | 7.4%(+13.3)#38 | 6.2%(+14.4)#503 |
| 39. | 18245 | 20.2% | 7.4%(+12.9)#39 | 6.2%(+14.0)#540 |
| 40. | 15547 | 20.0% | 7.4%(+12.6)#40 | 6.2%(+13.7)#557 |
| 41. | 16860 | 19.4% | 7.4%(+12.0)#41 | 6.2%(+13.1)#593 |
| 42. | 18625 | 19.2% | 7.4%(+11.8)#42 | 6.2%(+12.9)#602 |
| 43. | 17868 | 18.7% | 7.4%(+11.4)#43 | 6.2%(+12.5)#642 |
| 44. | 15955 | 18.7% | 7.4%(+11.4)#44 | 6.2%(+12.5)#644 |
| 45. | 18602 | 18.4% | 7.4%(+11.1)#45 | 6.2%(+12.2)#669 |
| 46. | 19096 | 18.2% | 7.4%(+10.8)#46 | 6.2%(+11.9)#687 |
| 47. | 18932 | 18.2% | 7.4%(+10.8)#47 | 6.2%(+11.9)#689 |
| 48. | 17840 | 18.0% | 7.4%(+10.7)#48 | 6.2%(+11.8)#704 |
| 49. | 17860 | 18.0% | 7.4%(+10.7)#49 | 6.2%(+11.8)#705 |
| 50. | 18616 | 17.5% | 7.4%(+10.2)#50 | 6.2%(+11.3)#760 |
| 51. | 18443 | 17.2% | 7.4%(+9.84)#51 | 6.2%(+10.9)#797 |
| 52. | 17949 | 17.0% | 7.4%(+9.63)#52 | 6.2%(+10.7)#820 |
| 53. | 15142 | 16.9% | 7.4%(+9.55)#53 | 6.2%(+10.7)#825 |
| 54. | 16624 | 16.8% | 7.4%(+9.47)#54 | 6.2%(+10.6)#838 |
| 55. | 16253 | 16.7% | 7.4%(+9.32)#55 | 6.2%(+10.4)#864 |
| 56. | 17036 | 16.6% | 7.4%(+9.27)#56 | 6.2%(+10.4)#871 |
| 57. | 15636 | 16.6% | 7.4%(+9.24)#57 | 6.2%(+10.4)#872 |
| 58. | 16045 | 16.6% | 7.4%(+9.24)#58 | 6.2%(+10.3)#874 |
| 59. | 15698 | 16.4% | 7.4%(+9.07)#59 | 6.2%(+10.2)#893 |
| 60. | 15416 | 16.4% | 7.4%(+9.03)#60 | 6.2%(+10.1)#901 |
| 61. | 19474 | 16.3% | 7.4%(+8.96)#61 | 6.2%(+10.1)#904 |
| 62. | 15619 | 16.3% | 7.4%(+8.93)#62 | 6.2%(+10.0)#911 |
| 63. | 16863 | 16.0% | 7.4%(+8.69)#63 | 6.2%(+9.80)#948 |
| 64. | 18347 | 15.9% | 7.4%(+8.60)#64 | 6.2%(+9.70)#961 |
| 65. | 18351 | 15.9% | 7.4%(+8.58)#65 | 6.2%(+9.68)#965 |
| 66. | 15376 | 15.8% | 7.4%(+8.47)#66 | 6.2%(+9.58)#985 |
| 67. | 15363 | 15.6% | 7.4%(+8.25)#67 | 6.2%(+9.36)#1,017 |
| 68. | 18912 | 15.6% | 7.4%(+8.20)#68 | 6.2%(+9.31)#1,028 |
| 69. | 15952 | 15.5% | 7.4%(+8.20)#69 | 6.2%(+9.30)#1,029 |
| 70. | 15925 | 15.5% | 7.4%(+8.17)#70 | 6.2%(+9.27)#1,037 |
| 71. | 19107 | 15.4% | 7.4%(+8.07)#71 | 6.2%(+9.18)#1,054 |
| 72. | 15827 | 15.2% | 7.4%(+7.90)#72 | 6.2%(+9.00)#1,094 |
| 73. | 18415 | 15.2% | 7.4%(+7.89)#73 | 6.2%(+9.00)#1,096 |
| 74. | 15502 | 15.1% | 7.4%(+7.74)#74 | 6.2%(+8.85)#1,131 |
| 75. | 15465 | 14.8% | 7.4%(+7.46)#75 | 6.2%(+8.57)#1,197 |
| 76. | 19103 | 14.8% | 7.4%(+7.40)#76 | 6.2%(+8.51)#1,205 |
| 77. | 17824 | 14.7% | 7.4%(+7.39)#77 | 6.2%(+8.50)#1,208 |
| 78. | 15379 | 14.7% | 7.4%(+7.35)#78 | 6.2%(+8.46)#1,219 |
| 79. | 17867 | 14.7% | 7.4%(+7.32)#79 | 6.2%(+8.42)#1,223 |
| 80. | 17311 | 14.7% | 7.4%(+7.32)#80 | 6.2%(+8.42)#1,224 |
| 81. | 17961 | 14.7% | 7.4%(+7.31)#81 | 6.2%(+8.42)#1,225 |
| 82. | 19106 | 14.6% | 7.4%(+7.27)#82 | 6.2%(+8.38)#1,234 |
| 83. | 18929 | 14.6% | 7.4%(+7.23)#83 | 6.2%(+8.34)#1,240 |
| 84. | 15139 | 14.5% | 7.4%(+7.19)#84 | 6.2%(+8.29)#1,249 |
| 85. | 18631 | 14.5% | 7.4%(+7.16)#85 | 6.2%(+8.27)#1,257 |
| 86. | 15665 | 14.5% | 7.4%(+7.16)#86 | 6.2%(+8.27)#1,258 |
| 87. | 15320 | 14.5% | 7.4%(+7.13)#87 | 6.2%(+8.24)#1,270 |
| 88. | 17938 | 14.4% | 7.4%(+7.04)#88 | 6.2%(+8.14)#1,297 |
| 89. | 18417 | 14.3% | 7.4%(+6.93)#89 | 6.2%(+8.04)#1,318 |
| 90. | 16622 | 14.3% | 7.4%(+6.93)#90 | 6.2%(+8.04)#1,330 |
| 91. | 18054 | 14.3% | 7.4%(+6.92)#91 | 6.2%(+8.02)#1,337 |
| 92. | 16033 | 14.3% | 7.4%(+6.91)#92 | 6.2%(+8.02)#1,338 |
| 93. | 15238 | 14.3% | 7.4%(+6.90)#93 | 6.2%(+8.01)#1,340 |
| 94. | 16665 | 14.2% | 7.4%(+6.87)#94 | 6.2%(+7.98)#1,347 |
| 95. | 19146 | 14.2% | 7.4%(+6.80)#95 | 6.2%(+7.91)#1,369 |
| 96. | 16046 | 14.1% | 7.4%(+6.75)#96 | 6.2%(+7.85)#1,382 |
| 97. | 16821 | 14.1% | 7.4%(+6.73)#97 | 6.2%(+7.84)#1,385 |
| 98. | 15201 | 14.0% | 7.4%(+6.66)#98 | 6.2%(+7.76)#1,410 |
| 99. | 17760 | 14.0% | 7.4%(+6.65)#99 | 6.2%(+7.76)#1,412 |
| 100. | 18059 | 14.0% | 7.4%(+6.63)#100 | 6.2%(+7.74)#1,417 |
Common Questions
What are the Top 10 Zip Codes with the Highest Percentage of Population Employed in Health Diagnosing & Treating in Pennsylvania?
Top 10 Zip Codes with the Highest Percentage of Population Employed in Health Diagnosing & Treating in Pennsylvania are:
What zip code has the Highest Percentage of Population Employed in Health Diagnosing & Treating in Pennsylvania?
17093 has the Highest Percentage of Population Employed in Health Diagnosing & Treating in Pennsylvania with 58.2%.
What is the Percentage of Population Employed in Health Diagnosing & Treating in the State of Pennsylvania?
Percentage of Population Employed in Health Diagnosing & Treating in Pennsylvania is 7.4%.
What is the Percentage of Population Employed in Health Diagnosing & Treating in the United States?
Percentage of Population Employed in Health Diagnosing & Treating in the United States is 6.2%.