Zip Codes with the Highest Percentage of Population Employed in Security & Protection in Pittsburgh, PA

RELATED REPORTS & OPTIONS

Security & Protection
Population
Families and Households
Female Fertility
Female Fertility (Unmarried)
Race (Community Size)
Race (Percentage)
Ancestry (Community Size)
AfghanAfricanAlbanianAlsatianAmericanApacheArabArgentineanArmenianAustralianAustrianBahamianBarbadianBasqueBelgianBhutaneseBlackfeetBolivianBrazilianBritishBritish West IndianBulgarianBurmeseCajunCambodianCanadianCape VerdeanCarpatho RusynCelticCentral AmericanCentral American IndianCherokeeChickasawChileanChippewaChoctawColombianComancheCosta RicanCreekCroatianCubanCypriotCzechCzechoslovakianDanishDelawareDominicanDutchEastern EuropeanEcuadorianEgyptianEnglishEthiopianEuropeanFilipinoFinnishFrenchFrench American IndianFrench CanadianGermanGhanaianGreekGuamanian / ChamorroGuatemalanGuyaneseHaitianHonduranHungarianIndian (Asian)IndonesianIranianIraqiIrishIroquoisIsraeliItalianJamaicanJapaneseJordanianKenyanKoreanLaotianLatvianLebaneseLiberianLithuanianLumbeeLuxembourgerMacedonianMalaysianMalteseMexicanMexican American IndianMongolianMoroccanNative HawaiianNavajoNew ZealanderNicaraguanNigerianNorthern EuropeanNorwegianPakistaniPalestinianPanamanianParaguayanPennsylvania GermanPeruvianPolishPortuguesePuerto RicanRomanianRussianSalvadoranSamoanScandinavianScotch-IrishScottishSeminoleSerbianSiouxSlavicSlovakSloveneSouth AfricanSouth AmericanSouth American IndianSoviet UnionSpaniardSpanishSri LankanSubsaharan AfricanSudaneseSwedishSwissSyrianThaiTrinidadian and TobagonianTurkishU.S. Virgin IslanderUgandanUkrainianUruguayanVenezuelanVietnameseWelshWest IndianYugoslavian
Ancestry (Percentage)
AfghanAfricanAlbanianAlsatianAmericanApacheArabArgentineanArmenianAustralianAustrianBahamianBarbadianBasqueBelgianBhutaneseBlackfeetBolivianBrazilianBritishBritish West IndianBulgarianBurmeseCajunCambodianCanadianCape VerdeanCarpatho RusynCelticCentral AmericanCentral American IndianCherokeeChickasawChileanChippewaChoctawColombianComancheCosta RicanCreekCroatianCubanCypriotCzechCzechoslovakianDanishDelawareDominicanDutchEastern EuropeanEcuadorianEgyptianEnglishEthiopianEuropeanFilipinoFinnishFrenchFrench American IndianFrench CanadianGermanGhanaianGreekGuamanian / ChamorroGuatemalanGuyaneseHaitianHonduranHungarianIndian (Asian)IndonesianIranianIraqiIrishIroquoisIsraeliItalianJamaicanJapaneseJordanianKenyanKoreanLaotianLatvianLebaneseLiberianLithuanianLumbeeLuxembourgerMacedonianMalaysianMalteseMexicanMexican American IndianMongolianMoroccanNative HawaiianNavajoNew ZealanderNicaraguanNigerianNorthern EuropeanNorwegianPakistaniPalestinianPanamanianParaguayanPennsylvania GermanPeruvianPolishPortuguesePuerto RicanRomanianRussianSalvadoranSamoanScandinavianScotch-IrishScottishSeminoleSerbianSiouxSlavicSlovakSloveneSouth AfricanSouth AmericanSouth American IndianSoviet UnionSpaniardSpanishSri LankanSubsaharan AfricanSudaneseSwedishSwissSyrianThaiTrinidadian and TobagonianTurkishU.S. Virgin IslanderUgandanUkrainianUruguayanVenezuelanVietnameseWelshWest IndianYugoslavian
Immigrant Origin (Total)
AfghanistanAfricaAlbaniaArgentinaAsiaAustraliaAustriaBahamasBangladeshBelarusBelgiumBoliviaBosnia and HerzegovinaBrazilBulgariaBurma / MyanmarCambodiaCameroonCanadaCaribbeanCentral AmericaChileChinaColombiaCongoCosta RicaCroatiaCubaCzechoslovakiaDenmarkDominican RepublicEastern AfricaEastern AsiaEastern EuropeEcuadorEgyptEl SalvadorEnglandEritreaEthiopiaEuropeFranceGermanyGhanaGreeceGuatemalaGuyanaHaitiHondurasHong KongHungaryIndiaIndonesiaIranIraqIrelandIsraelItalyJamaicaJapanJordanKazakhstanKenyaKoreaKuwaitLatin AmericaLatviaLebanonLiberiaLithuaniaMalaysiaMexicoMiddle AfricaMoldovaMoroccoNepalNetherlandsNigeriaNorthern AfricaNorthern EuropeNorwayOceaniaPakistanPanamaPeruPhilippinesPolandPortugalRomaniaRussiaSaudi ArabiaScotlandSerbiaSingaporeSouth AfricaSouth AmericaSouth Central AsiaSouth Eastern AsiaSouthern EuropeSpainSri LankaSudanSwedenSwitzerlandSyriaTaiwanThailandTrinidad and TobagoTurkeyUgandaUkraineUzbekistanVenezuelaVietnamWestern AfricaWestern AsiaWestern EuropeZaire
Immigrant Origin (Percentage)
AfghanistanAfricaAlbaniaArgentinaAsiaAustraliaAustriaBahamasBangladeshBelarusBelgiumBoliviaBosnia and HerzegovinaBrazilBulgariaBurma / MyanmarCambodiaCameroonCanadaCaribbeanCentral AmericaChileChinaColombiaCongoCosta RicaCroatiaCubaCzechoslovakiaDenmarkDominican RepublicEastern AfricaEastern AsiaEastern EuropeEcuadorEgyptEl SalvadorEnglandEritreaEthiopiaEuropeFranceGermanyGhanaGreeceGuatemalaGuyanaHaitiHondurasHong KongHungaryIndiaIndonesiaIranIraqIrelandIsraelItalyJamaicaJapanJordanKazakhstanKenyaKoreaKuwaitLatin AmericaLatviaLebanonLiberiaLithuaniaMalaysiaMexicoMiddle AfricaMoldovaMoroccoNepalNetherlandsNigeriaNorthern AfricaNorthern EuropeNorwayOceaniaPakistanPanamaPeruPhilippinesPolandPortugalRomaniaRussiaSaudi ArabiaScotlandSerbiaSingaporeSouth AfricaSouth AmericaSouth Central AsiaSouth Eastern AsiaSouthern EuropeSpainSri LankaSudanSwedenSwitzerlandSyriaTaiwanThailandTrinidad and TobagoTurkeyUgandaUkraineUzbekistanVenezuelaVietnamWestern AfricaWestern AsiaWestern EuropeZaire
Income
Income (Families)
Income (Households)
Poverty
Poverty (Families)
Unemployment
Employment Occupations
Employment Industries
Employer Class
Commute Time
Commute Means
School Enrollment
Education by Degree Field
Occupancy
Finances
Physical Characteristics
Pittsburgh
Compare Zip Codes
Comparison Subject

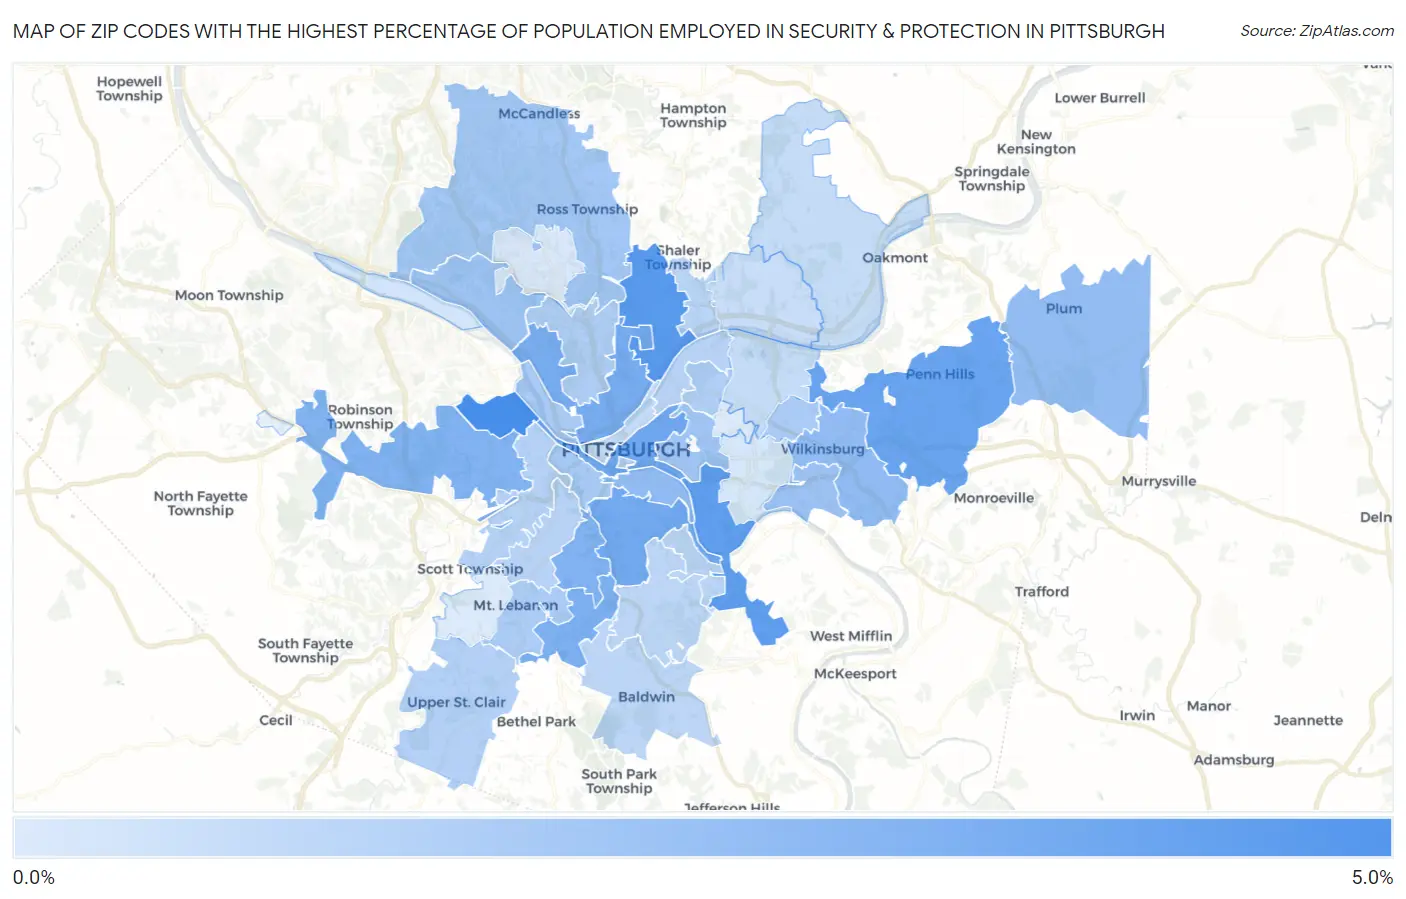
Map of Zip Codes with the Highest Percentage of Population Employed in Security & Protection in Pittsburgh

0.0%
5.0%
Zip Codes with the Highest Percentage of Population Employed in Security & Protection in Pittsburgh Map

Zip Codes with the Highest Percentage of Population Employed in Security & Protection in Pittsburgh, PA

Zip Code % Employed vs State vs National
1.152044.1%2.0%(+2.13)#1872.1%(+2.00)#4,217
2.152093.7%2.0%(+1.72)#2212.1%(+1.59)#5,050
3.152073.5%2.0%(+1.49)#2492.1%(+1.36)#5,652
4.152353.2%2.0%(+1.22)#2942.1%(+1.10)#6,414
5.152193.1%2.0%(+1.08)#3172.1%(+0.950)#6,893
6.152103.0%2.0%(+1.00)#3322.1%(+0.874)#7,135
7.152122.9%2.0%(+0.866)#3572.1%(+0.738)#7,704
8.152342.8%2.0%(+0.773)#3832.1%(+0.644)#8,140
9.152262.7%2.0%(+0.668)#4032.1%(+0.539)#8,595
10.152052.7%2.0%(+0.636)#4152.1%(+0.507)#8,734
11.152032.3%2.0%(+0.276)#5162.1%(+0.148)#10,666
12.152212.3%2.0%(+0.271)#5192.1%(+0.142)#10,701
13.152392.2%2.0%(+0.174)#5572.1%(+0.045)#11,294
14.152182.0%2.0%(-0.055)#6382.1%(-0.184)#12,788
15.152021.9%2.0%(-0.123)#6632.1%(-0.252)#13,241
16.152131.9%2.0%(-0.153)#6762.1%(-0.282)#13,463
17.152371.8%2.0%(-0.221)#7052.1%(-0.350)#13,962
18.152111.7%2.0%(-0.327)#7522.1%(-0.456)#14,739
19.152331.6%2.0%(-0.412)#7912.1%(-0.541)#15,353
20.152081.6%2.0%(-0.413)#7922.1%(-0.542)#15,369
21.152281.6%2.0%(-0.431)#7982.1%(-0.559)#15,487
22.152141.5%2.0%(-0.498)#8272.1%(-0.627)#16,025
23.152241.5%2.0%(-0.530)#8412.1%(-0.659)#16,288
24.152411.4%2.0%(-0.626)#8732.1%(-0.755)#16,995
25.152201.4%2.0%(-0.665)#8912.1%(-0.794)#17,294
26.152821.3%2.0%(-0.686)#8992.1%(-0.814)#17,463
27.152161.3%2.0%(-0.722)#9092.1%(-0.851)#17,751
28.152011.3%2.0%(-0.723)#9102.1%(-0.852)#17,762
29.152231.2%2.0%(-0.796)#9462.1%(-0.924)#18,325
30.152271.2%2.0%(-0.833)#9622.1%(-0.961)#18,609
31.152361.2%2.0%(-0.852)#9712.1%(-0.980)#18,759
32.152220.98%2.0%(-1.04)#1,0522.1%(-1.17)#20,178
33.152380.97%2.0%(-1.05)#1,0562.1%(-1.18)#20,272
34.152060.93%2.0%(-1.09)#1,0792.1%(-1.22)#20,552
35.152150.87%2.0%(-1.15)#1,1002.1%(-1.28)#20,995
36.152250.60%2.0%(-1.42)#1,1972.1%(-1.55)#22,668
37.152170.53%2.0%(-1.49)#1,2172.1%(-1.61)#23,050
38.152290.45%2.0%(-1.57)#1,2352.1%(-1.70)#23,478
39.152430.38%2.0%(-1.64)#1,2552.1%(-1.77)#23,830
40.152320.37%2.0%(-1.65)#1,2562.1%(-1.77)#23,853

Common Questions

What are the Top 10 Zip Codes with the Highest Percentage of Population Employed in Security & Protection in Pittsburgh, PA?
Top 10 Zip Codes with the Highest Percentage of Population Employed in Security & Protection in Pittsburgh, PA are:
#1
4.1%
#2
3.7%
#3
3.5%
#4
3.2%
#5
3.1%
#6
3.0%
#7
2.9%
#8
2.8%
#9
2.7%
#10
2.7%
What zip code has the Highest Percentage of Population Employed in Security & Protection in Pittsburgh, PA?
15204 has the Highest Percentage of Population Employed in Security & Protection in Pittsburgh, PA with 4.1%.
What is the Percentage of Population Employed in Security & Protection in Pittsburgh, PA?
Percentage of Population Employed in Security & Protection in Pittsburgh is 2.0%.
What is the Percentage of Population Employed in Security & Protection in Pennsylvania?
Percentage of Population Employed in Security & Protection in Pennsylvania is 2.0%.
What is the Percentage of Population Employed in Security & Protection in the United States?
Percentage of Population Employed in Security & Protection in the United States is 2.1%.