Zip Codes with the Highest Percentage of Population Employed in Sales & Related in Pennsylvania
RELATED REPORTS & OPTIONS
Sales & Related
Pennsylvania
Compare Zip Codes
Map of Zip Codes with the Highest Percentage of Population Employed in Sales & Related in Pennsylvania
0.0%
100.0%
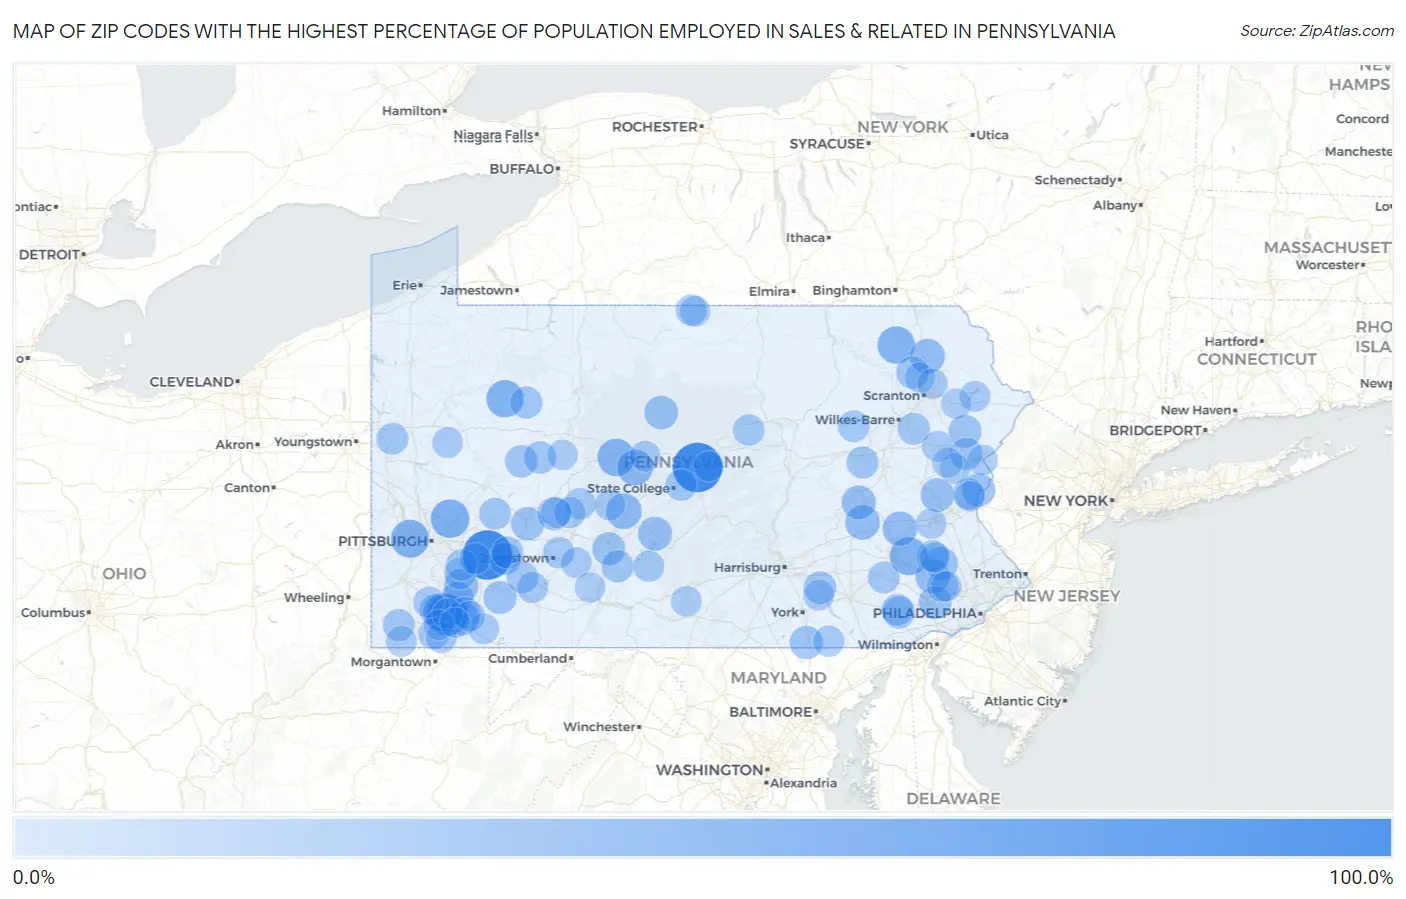
Zip Codes with the Highest Percentage of Population Employed in Sales & Related in Pennsylvania
| Zip Code | % Employed | vs State | vs National | |
| 1. | 15635 | 100.0% | 9.1% (+90.9)#1 | 9.6% (+90.4)#19 |
| 2. | 16856 | 100.0% | 9.1% (+90.9)#2 | 9.6% (+90.4)#33 |
| 3. | 15435 | 62.5% | 9.1% (+53.4)#3 | 9.6% (+52.9)#63 |
| 4. | 15075 | 52.6% | 9.1% (+43.5)#4 | 9.6% (+43.0)#88 |
| 5. | 15463 | 50.5% | 9.1% (+41.4)#5 | 9.6% (+40.9)#100 |
| 6. | 19535 | 50.0% | 9.1% (+40.9)#6 | 9.6% (+40.4)#111 |
| 7. | 15275 | 50.0% | 9.1% (+40.9)#7 | 9.6% (+40.4)#124 |
| 8. | 18816 | 47.6% | 9.1% (+38.5)#8 | 9.6% (+38.0)#136 |
| 9. | 16855 | 47.2% | 9.1% (+38.1)#9 | 9.6% (+37.6)#139 |
| 10. | 16361 | 47.1% | 9.1% (+37.9)#10 | 9.6% (+37.5)#142 |
| 11. | 16840 | 40.8% | 9.1% (+31.7)#11 | 9.6% (+31.3)#193 |
| 12. | 16684 | 40.0% | 9.1% (+30.9)#12 | 9.6% (+30.4)#201 |
| 13. | 18441 | 36.0% | 9.1% (+26.8)#13 | 9.6% (+26.4)#254 |
| 14. | 17979 | 35.9% | 9.1% (+26.8)#14 | 9.6% (+26.3)#257 |
| 15. | 19564 | 35.3% | 9.1% (+26.2)#15 | 9.6% (+25.7)#266 |
| 16. | 15448 | 34.9% | 9.1% (+25.7)#16 | 9.6% (+25.3)#277 |
| 17. | 19457 | 34.2% | 9.1% (+25.0)#17 | 9.6% (+24.6)#288 |
| 18. | 17974 | 33.6% | 9.1% (+24.5)#18 | 9.6% (+24.0)#301 |
| 19. | 16654 | 33.3% | 9.1% (+24.2)#19 | 9.6% (+23.7)#305 |
| 20. | 18035 | 32.0% | 9.1% (+22.9)#20 | 9.6% (+22.4)#347 |
| 21. | 17778 | 31.4% | 9.1% (+22.2)#21 | 9.6% (+21.8)#365 |
| 22. | 15472 | 30.7% | 9.1% (+21.5)#22 | 9.6% (+21.1)#386 |
| 23. | 15754 | 30.0% | 9.1% (+20.9)#23 | 9.6% (+20.4)#399 |
| 24. | 17355 | 29.9% | 9.1% (+20.8)#24 | 9.6% (+20.4)#402 |
| 25. | 18063 | 29.8% | 9.1% (+20.6)#25 | 9.6% (+20.2)#408 |
| 26. | 19492 | 28.9% | 9.1% (+19.8)#26 | 9.6% (+19.3)#436 |
| 27. | 16665 | 28.9% | 9.1% (+19.7)#27 | 9.6% (+19.3)#440 |
| 28. | 15462 | 28.7% | 9.1% (+19.6)#28 | 9.6% (+19.2)#445 |
| 29. | 15745 | 28.4% | 9.1% (+19.3)#29 | 9.6% (+18.8)#458 |
| 30. | 19345 | 28.4% | 9.1% (+19.2)#30 | 9.6% (+18.8)#459 |
| 31. | 18342 | 28.2% | 9.1% (+19.1)#31 | 9.6% (+18.6)#466 |
| 32. | 18440 | 27.3% | 9.1% (+18.1)#32 | 9.6% (+17.7)#510 |
| 33. | 17570 | 26.7% | 9.1% (+17.6)#33 | 9.6% (+17.1)#531 |
| 34. | 15778 | 26.5% | 9.1% (+17.4)#34 | 9.6% (+17.0)#539 |
| 35. | 15764 | 26.5% | 9.1% (+17.4)#35 | 9.6% (+16.9)#541 |
| 36. | 18321 | 25.8% | 9.1% (+16.6)#36 | 9.6% (+16.2)#580 |
| 37. | 15828 | 25.6% | 9.1% (+16.5)#37 | 9.6% (+16.0)#594 |
| 38. | 15620 | 25.0% | 9.1% (+15.9)#38 | 9.6% (+15.4)#627 |
| 39. | 19367 | 25.0% | 9.1% (+15.9)#39 | 9.6% (+15.4)#634 |
| 40. | 19472 | 25.0% | 9.1% (+15.9)#40 | 9.6% (+15.4)#640 |
| 41. | 16631 | 25.0% | 9.1% (+15.9)#41 | 9.6% (+15.4)#646 |
| 42. | 18246 | 24.8% | 9.1% (+15.7)#42 | 9.6% (+15.2)#657 |
| 43. | 15671 | 24.5% | 9.1% (+15.4)#43 | 9.6% (+14.9)#680 |
| 44. | 18602 | 24.5% | 9.1% (+15.4)#44 | 9.6% (+14.9)#681 |
| 45. | 15686 | 24.5% | 9.1% (+15.4)#45 | 9.6% (+14.9)#682 |
| 46. | 15482 | 24.4% | 9.1% (+15.3)#46 | 9.6% (+14.8)#692 |
| 47. | 15359 | 24.1% | 9.1% (+15.0)#47 | 9.6% (+14.5)#706 |
| 48. | 16172 | 23.7% | 9.1% (+14.5)#48 | 9.6% (+14.1)#746 |
| 49. | 17507 | 23.4% | 9.1% (+14.3)#49 | 9.6% (+13.8)#763 |
| 50. | 18622 | 23.3% | 9.1% (+14.1)#50 | 9.6% (+13.7)#769 |
| 51. | 19369 | 23.2% | 9.1% (+14.1)#51 | 9.6% (+13.6)#775 |
| 52. | 18083 | 22.9% | 9.1% (+13.7)#52 | 9.6% (+13.3)#813 |
| 53. | 15655 | 22.6% | 9.1% (+13.4)#53 | 9.6% (+13.0)#839 |
| 54. | 16851 | 22.4% | 9.1% (+13.2)#54 | 9.6% (+12.8)#862 |
| 55. | 15640 | 22.2% | 9.1% (+13.0)#55 | 9.6% (+12.6)#880 |
| 56. | 19453 | 22.2% | 9.1% (+13.0)#56 | 9.6% (+12.6)#882 |
| 57. | 17720 | 22.0% | 9.1% (+12.9)#57 | 9.6% (+12.4)#897 |
| 58. | 15433 | 21.8% | 9.1% (+12.7)#58 | 9.6% (+12.2)#917 |
| 59. | 15678 | 21.8% | 9.1% (+12.7)#59 | 9.6% (+12.2)#920 |
| 60. | 16675 | 21.7% | 9.1% (+12.6)#60 | 9.6% (+12.1)#932 |
| 61. | 15489 | 21.6% | 9.1% (+12.5)#61 | 9.6% (+12.0)#949 |
| 62. | 15775 | 21.4% | 9.1% (+12.3)#62 | 9.6% (+11.8)#968 |
| 63. | 15945 | 21.2% | 9.1% (+12.1)#63 | 9.6% (+11.7)#989 |
| 64. | 15634 | 21.2% | 9.1% (+12.1)#64 | 9.6% (+11.6)#994 |
| 65. | 15333 | 21.0% | 9.1% (+11.9)#65 | 9.6% (+11.4)#1,013 |
| 66. | 15544 | 20.7% | 9.1% (+11.6)#66 | 9.6% (+11.1)#1,060 |
| 67. | 16685 | 20.7% | 9.1% (+11.5)#67 | 9.6% (+11.1)#1,065 |
| 68. | 17352 | 20.7% | 9.1% (+11.5)#68 | 9.6% (+11.1)#1,068 |
| 69. | 16937 | 20.6% | 9.1% (+11.4)#69 | 9.6% (+11.0)#1,083 |
| 70. | 15334 | 20.6% | 9.1% (+11.4)#70 | 9.6% (+11.0)#1,086 |
| 71. | 15316 | 20.3% | 9.1% (+11.1)#71 | 9.6% (+10.7)#1,125 |
| 72. | 18451 | 20.0% | 9.1% (+10.9)#72 | 9.6% (+10.4)#1,147 |
| 73. | 17550 | 19.8% | 9.1% (+10.6)#73 | 9.6% (+10.2)#1,185 |
| 74. | 15467 | 19.6% | 9.1% (+10.5)#74 | 9.6% (+10.0)#1,209 |
| 75. | 15470 | 19.6% | 9.1% (+10.5)#75 | 9.6% (+10.0)#1,211 |
| 76. | 18610 | 19.5% | 9.1% (+10.4)#76 | 9.6% (+9.90)#1,239 |
| 77. | 16839 | 19.4% | 9.1% (+10.3)#77 | 9.6% (+9.82)#1,258 |
| 78. | 15761 | 19.4% | 9.1% (+10.2)#78 | 9.6% (+9.76)#1,266 |
| 79. | 16040 | 19.3% | 9.1% (+10.2)#79 | 9.6% (+9.71)#1,278 |
| 80. | 16619 | 19.2% | 9.1% (+10.1)#80 | 9.6% (+9.64)#1,292 |
| 81. | 15468 | 18.9% | 9.1% (+9.76)#81 | 9.6% (+9.31)#1,370 |
| 82. | 16927 | 18.9% | 9.1% (+9.74)#82 | 9.6% (+9.29)#1,373 |
| 83. | 15930 | 18.9% | 9.1% (+9.73)#83 | 9.6% (+9.27)#1,376 |
| 84. | 17265 | 18.8% | 9.1% (+9.68)#84 | 9.6% (+9.23)#1,382 |
| 85. | 18327 | 18.8% | 9.1% (+9.65)#85 | 9.6% (+9.19)#1,387 |
| 86. | 18322 | 18.6% | 9.1% (+9.50)#86 | 9.6% (+9.04)#1,414 |
| 87. | 15456 | 18.6% | 9.1% (+9.47)#87 | 9.6% (+9.02)#1,418 |
| 88. | 19435 | 18.6% | 9.1% (+9.46)#88 | 9.6% (+9.01)#1,419 |
| 89. | 19456 | 18.3% | 9.1% (+9.19)#89 | 9.6% (+8.74)#1,479 |
| 90. | 15351 | 18.3% | 9.1% (+9.14)#90 | 9.6% (+8.68)#1,494 |
| 91. | 16852 | 18.2% | 9.1% (+9.04)#91 | 9.6% (+8.59)#1,529 |
| 92. | 15863 | 18.2% | 9.1% (+9.04)#92 | 9.6% (+8.59)#1,531 |
| 93. | 18085 | 18.1% | 9.1% (+8.94)#93 | 9.6% (+8.48)#1,553 |
| 94. | 18471 | 18.1% | 9.1% (+8.92)#94 | 9.6% (+8.47)#1,557 |
| 95. | 18463 | 18.0% | 9.1% (+8.90)#95 | 9.6% (+8.45)#1,559 |
| 96. | 18452 | 18.0% | 9.1% (+8.83)#96 | 9.6% (+8.38)#1,573 |
| 97. | 18330 | 18.0% | 9.1% (+8.81)#97 | 9.6% (+8.36)#1,578 |
| 98. | 15539 | 17.9% | 9.1% (+8.77)#98 | 9.6% (+8.32)#1,591 |
| 99. | 18087 | 17.9% | 9.1% (+8.73)#99 | 9.6% (+8.28)#1,598 |
| 100. | 15484 | 17.8% | 9.1% (+8.70)#100 | 9.6% (+8.24)#1,609 |
Common Questions
What are the Top 10 Zip Codes with the Highest Percentage of Population Employed in Sales & Related in Pennsylvania?
Top 10 Zip Codes with the Highest Percentage of Population Employed in Sales & Related in Pennsylvania are:
What zip code has the Highest Percentage of Population Employed in Sales & Related in Pennsylvania?
15635 has the Highest Percentage of Population Employed in Sales & Related in Pennsylvania with 100.0%.
What is the Percentage of Population Employed in Sales & Related in the State of Pennsylvania?
Percentage of Population Employed in Sales & Related in Pennsylvania is 9.1%.
What is the Percentage of Population Employed in Sales & Related in the United States?
Percentage of Population Employed in Sales & Related in the United States is 9.6%.