Zip Codes with the Highest Percentage of Population Employed in Food Preparation & Serving in Las Vegas, NV
RELATED REPORTS & OPTIONS
Food Preparation & Serving
Las Vegas
Compare Zip Codes
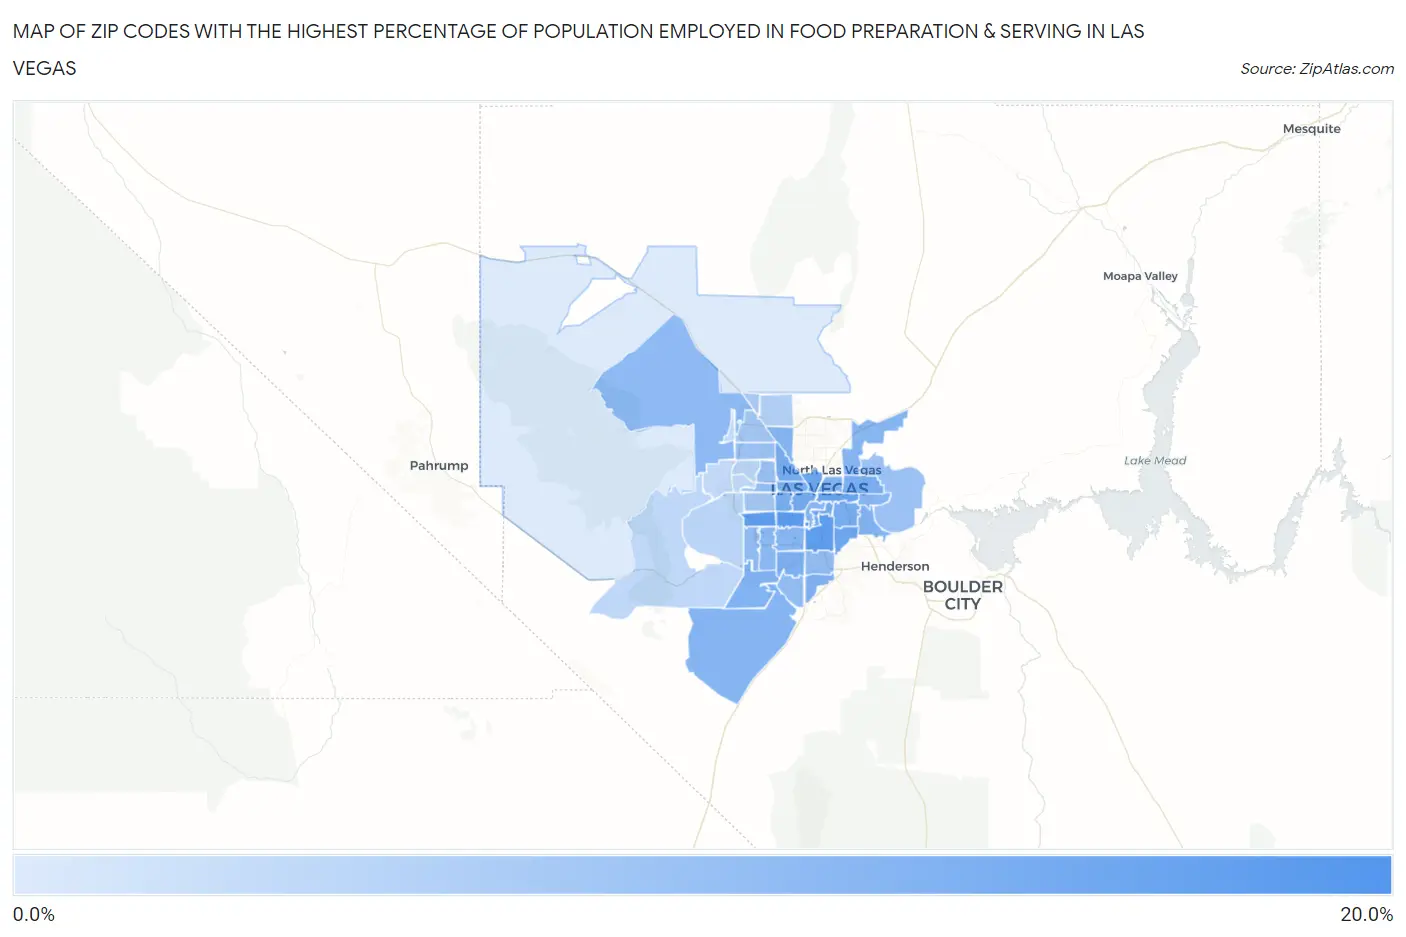
Map of Zip Codes with the Highest Percentage of Population Employed in Food Preparation & Serving in Las Vegas
0.33%
18.8%
Zip Codes with the Highest Percentage of Population Employed in Food Preparation & Serving in Las Vegas, NV
| Zip Code | % Employed | vs State | vs National | |
| 1. | 89158 | 18.8% | 8.6%(+10.1)#6 | 5.3%(+13.5)#585 |
| 2. | 89103 | 16.1% | 8.6%(+7.41)#9 | 5.3%(+10.8)#860 |
| 3. | 89119 | 15.3% | 8.6%(+6.70)#11 | 5.3%(+10.1)#939 |
| 4. | 89147 | 15.3% | 8.6%(+6.69)#12 | 5.3%(+10.0)#940 |
| 5. | 89106 | 14.0% | 8.6%(+5.33)#15 | 5.3%(+8.68)#1,169 |
| 6. | 89104 | 14.0% | 8.6%(+5.32)#16 | 5.3%(+8.67)#1,172 |
| 7. | 89120 | 13.7% | 8.6%(+5.07)#17 | 5.3%(+8.43)#1,229 |
| 8. | 89169 | 13.1% | 8.6%(+4.41)#18 | 5.3%(+7.77)#1,380 |
| 9. | 89102 | 12.8% | 8.6%(+4.11)#19 | 5.3%(+7.47)#1,449 |
| 10. | 89108 | 12.5% | 8.6%(+3.83)#20 | 5.3%(+7.19)#1,527 |
| 11. | 89146 | 12.2% | 8.6%(+3.58)#22 | 5.3%(+6.94)#1,589 |
| 12. | 89121 | 12.0% | 8.6%(+3.39)#23 | 5.3%(+6.75)#1,651 |
| 13. | 89110 | 12.0% | 8.6%(+3.32)#24 | 5.3%(+6.67)#1,683 |
| 14. | 89107 | 11.9% | 8.6%(+3.23)#25 | 5.3%(+6.59)#1,710 |
| 15. | 89139 | 11.5% | 8.6%(+2.84)#27 | 5.3%(+6.19)#1,849 |
| 16. | 89183 | 11.4% | 8.6%(+2.72)#28 | 5.3%(+6.08)#1,894 |
| 17. | 89178 | 11.3% | 8.6%(+2.63)#29 | 5.3%(+5.98)#1,928 |
| 18. | 89101 | 11.1% | 8.6%(+2.51)#30 | 5.3%(+5.86)#1,983 |
| 19. | 89122 | 10.9% | 8.6%(+2.24)#31 | 5.3%(+5.59)#2,118 |
| 20. | 89179 | 10.8% | 8.6%(+2.17)#32 | 5.3%(+5.52)#2,153 |
| 21. | 89130 | 10.6% | 8.6%(+2.00)#34 | 5.3%(+5.35)#2,236 |
| 22. | 89142 | 10.4% | 8.6%(+1.78)#35 | 5.3%(+5.14)#2,361 |
| 23. | 89109 | 10.4% | 8.6%(+1.78)#36 | 5.3%(+5.13)#2,364 |
| 24. | 89118 | 10.4% | 8.6%(+1.72)#37 | 5.3%(+5.07)#2,395 |
| 25. | 89115 | 10.3% | 8.6%(+1.68)#38 | 5.3%(+5.04)#2,407 |
| 26. | 89113 | 10.0% | 8.6%(+1.39)#40 | 5.3%(+4.75)#2,604 |
| 27. | 89166 | 9.6% | 8.6%(+0.949)#43 | 5.3%(+4.30)#2,984 |
| 28. | 89148 | 9.2% | 8.6%(+0.596)#51 | 5.3%(+3.95)#3,285 |
| 29. | 89141 | 9.0% | 8.6%(+0.372)#55 | 5.3%(+3.73)#3,512 |
| 30. | 89123 | 9.0% | 8.6%(+0.368)#56 | 5.3%(+3.72)#3,520 |
| 31. | 89145 | 8.7% | 8.6%(+0.027)#59 | 5.3%(+3.38)#3,895 |
| 32. | 89128 | 8.3% | 8.6%(-0.310)#66 | 5.3%(+3.05)#4,279 |
| 33. | 89156 | 8.0% | 8.6%(-0.633)#68 | 5.3%(+2.72)#4,712 |
| 34. | 89129 | 7.8% | 8.6%(-0.886)#69 | 5.3%(+2.47)#5,132 |
| 35. | 89149 | 7.2% | 8.6%(-1.47)#76 | 5.3%(+1.89)#6,186 |
| 36. | 89117 | 6.9% | 8.6%(-1.77)#78 | 5.3%(+1.58)#6,889 |
| 37. | 89143 | 6.1% | 8.6%(-2.54)#85 | 5.3%(+0.812)#9,029 |
| 38. | 89131 | 5.0% | 8.6%(-3.62)#94 | 5.3%(-0.261)#12,843 |
| 39. | 89134 | 4.2% | 8.6%(-4.40)#104 | 5.3%(-1.04)#16,130 |
| 40. | 89135 | 4.2% | 8.6%(-4.46)#105 | 5.3%(-1.10)#16,378 |
| 41. | 89161 | 3.7% | 8.6%(-4.91)#111 | 5.3%(-1.55)#18,203 |
| 42. | 89138 | 3.6% | 8.6%(-5.08)#115 | 5.3%(-1.73)#18,959 |
| 43. | 89144 | 3.5% | 8.6%(-5.11)#116 | 5.3%(-1.76)#19,084 |
| 44. | 89124 | 0.33% | 8.6%(-8.31)#138 | 5.3%(-4.96)#27,829 |
1
Common Questions
What are the Top 10 Zip Codes with the Highest Percentage of Population Employed in Food Preparation & Serving in Las Vegas, NV?
Top 10 Zip Codes with the Highest Percentage of Population Employed in Food Preparation & Serving in Las Vegas, NV are:
What zip code has the Highest Percentage of Population Employed in Food Preparation & Serving in Las Vegas, NV?
89158 has the Highest Percentage of Population Employed in Food Preparation & Serving in Las Vegas, NV with 18.8%.
What is the Percentage of Population Employed in Food Preparation & Serving in Las Vegas, NV?
Percentage of Population Employed in Food Preparation & Serving in Las Vegas is 9.3%.
What is the Percentage of Population Employed in Food Preparation & Serving in Nevada?
Percentage of Population Employed in Food Preparation & Serving in Nevada is 8.6%.
What is the Percentage of Population Employed in Food Preparation & Serving in the United States?
Percentage of Population Employed in Food Preparation & Serving in the United States is 5.3%.