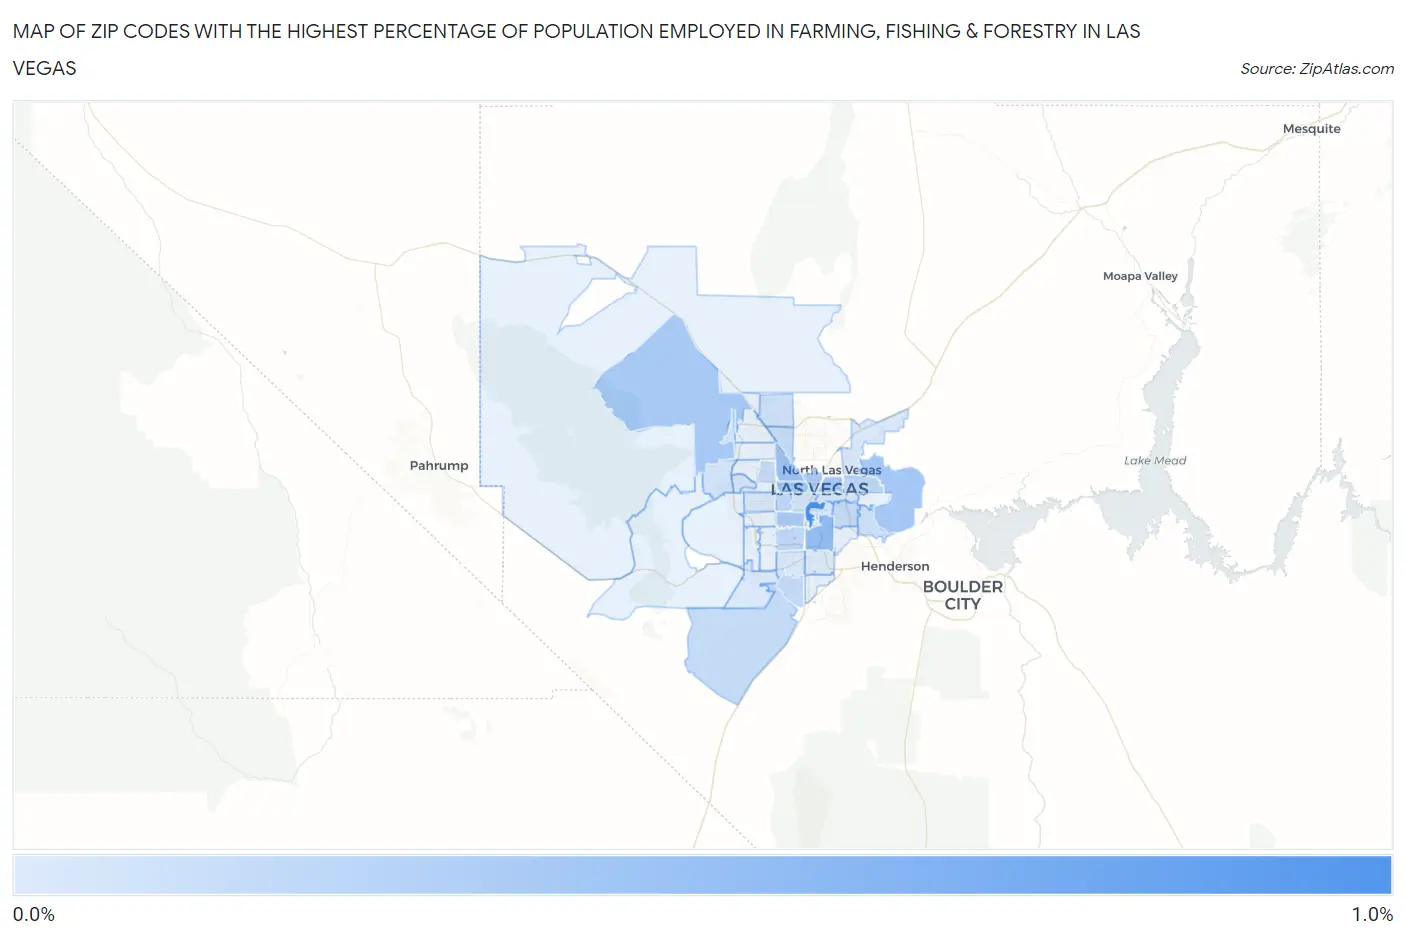
Zip Codes with the Highest Percentage of Population Employed in Farming, Fishing & Forestry in Las Vegas, NV
RELATED REPORTS & OPTIONS
Farming, Fishing & Forestry
Las Vegas
Compare Zip Codes
Map of Zip Codes with the Highest Percentage of Population Employed in Farming, Fishing & Forestry in Las Vegas
0.016%
0.94%

Zip Codes with the Highest Percentage of Population Employed in Farming, Fishing & Forestry in Las Vegas, NV
| Zip Code | % Employed | vs State | vs National | |
| 1. | 89109 | 0.94% | 0.19%(+0.750)#24 | 0.61%(+0.331)#10,060 |
| 2. | 89119 | 0.46% | 0.19%(+0.275)#30 | 0.61%(-0.144)#13,169 |
| 3. | 89108 | 0.43% | 0.19%(+0.242)#34 | 0.61%(-0.177)#13,508 |
| 4. | 89107 | 0.37% | 0.19%(+0.186)#35 | 0.61%(-0.233)#14,020 |
| 5. | 89156 | 0.36% | 0.19%(+0.170)#36 | 0.61%(-0.249)#14,185 |
| 6. | 89101 | 0.35% | 0.19%(+0.163)#37 | 0.61%(-0.256)#14,273 |
| 7. | 89103 | 0.34% | 0.19%(+0.154)#39 | 0.61%(-0.265)#14,357 |
| 8. | 89166 | 0.34% | 0.19%(+0.150)#40 | 0.61%(-0.269)#14,409 |
| 9. | 89106 | 0.33% | 0.19%(+0.143)#42 | 0.61%(-0.275)#14,485 |
| 10. | 89118 | 0.20% | 0.19%(+0.012)#48 | 0.61%(-0.407)#16,150 |
| 11. | 89110 | 0.20% | 0.19%(+0.010)#49 | 0.61%(-0.408)#16,175 |
| 12. | 89146 | 0.19% | 0.19%(+0.000)#50 | 0.61%(-0.418)#16,324 |
| 13. | 89128 | 0.17% | 0.19%(-0.020)#53 | 0.61%(-0.439)#16,630 |
| 14. | 89141 | 0.17% | 0.19%(-0.020)#54 | 0.61%(-0.439)#16,633 |
| 15. | 89121 | 0.15% | 0.19%(-0.032)#57 | 0.61%(-0.451)#16,839 |
| 16. | 89179 | 0.15% | 0.19%(-0.036)#58 | 0.61%(-0.455)#16,903 |
| 17. | 89130 | 0.14% | 0.19%(-0.046)#61 | 0.61%(-0.465)#17,088 |
| 18. | 89122 | 0.095% | 0.19%(-0.092)#66 | 0.61%(-0.511)#17,851 |
| 19. | 89131 | 0.094% | 0.19%(-0.093)#67 | 0.61%(-0.512)#17,866 |
| 20. | 89138 | 0.091% | 0.19%(-0.096)#69 | 0.61%(-0.515)#17,915 |
| 21. | 89104 | 0.079% | 0.19%(-0.108)#73 | 0.61%(-0.527)#18,140 |
| 22. | 89102 | 0.075% | 0.19%(-0.112)#74 | 0.61%(-0.531)#18,211 |
| 23. | 89144 | 0.072% | 0.19%(-0.114)#76 | 0.61%(-0.533)#18,258 |
| 24. | 89139 | 0.046% | 0.19%(-0.141)#80 | 0.61%(-0.559)#18,716 |
| 25. | 89117 | 0.044% | 0.19%(-0.142)#82 | 0.61%(-0.561)#18,753 |
| 26. | 89169 | 0.038% | 0.19%(-0.148)#84 | 0.61%(-0.567)#18,834 |
| 27. | 89178 | 0.032% | 0.19%(-0.155)#85 | 0.61%(-0.574)#18,933 |
| 28. | 89115 | 0.029% | 0.19%(-0.158)#88 | 0.61%(-0.577)#18,976 |
| 29. | 89123 | 0.016% | 0.19%(-0.171)#91 | 0.61%(-0.590)#19,109 |
1
Common Questions
What are the Top 10 Zip Codes with the Highest Percentage of Population Employed in Farming, Fishing & Forestry in Las Vegas, NV?
Top 10 Zip Codes with the Highest Percentage of Population Employed in Farming, Fishing & Forestry in Las Vegas, NV are:
What zip code has the Highest Percentage of Population Employed in Farming, Fishing & Forestry in Las Vegas, NV?
89109 has the Highest Percentage of Population Employed in Farming, Fishing & Forestry in Las Vegas, NV with 0.94%.
What is the Percentage of Population Employed in Farming, Fishing & Forestry in Las Vegas, NV?
Percentage of Population Employed in Farming, Fishing & Forestry in Las Vegas is 0.17%.
What is the Percentage of Population Employed in Farming, Fishing & Forestry in Nevada?
Percentage of Population Employed in Farming, Fishing & Forestry in Nevada is 0.19%.
What is the Percentage of Population Employed in Farming, Fishing & Forestry in the United States?
Percentage of Population Employed in Farming, Fishing & Forestry in the United States is 0.61%.