Zip Codes with the Lowest Percentage of Renter-Occupied Units in Las Vegas, NV
RELATED REPORTS & OPTIONS
Lowest Renter-Occupied
Las Vegas
Compare Zip Codes
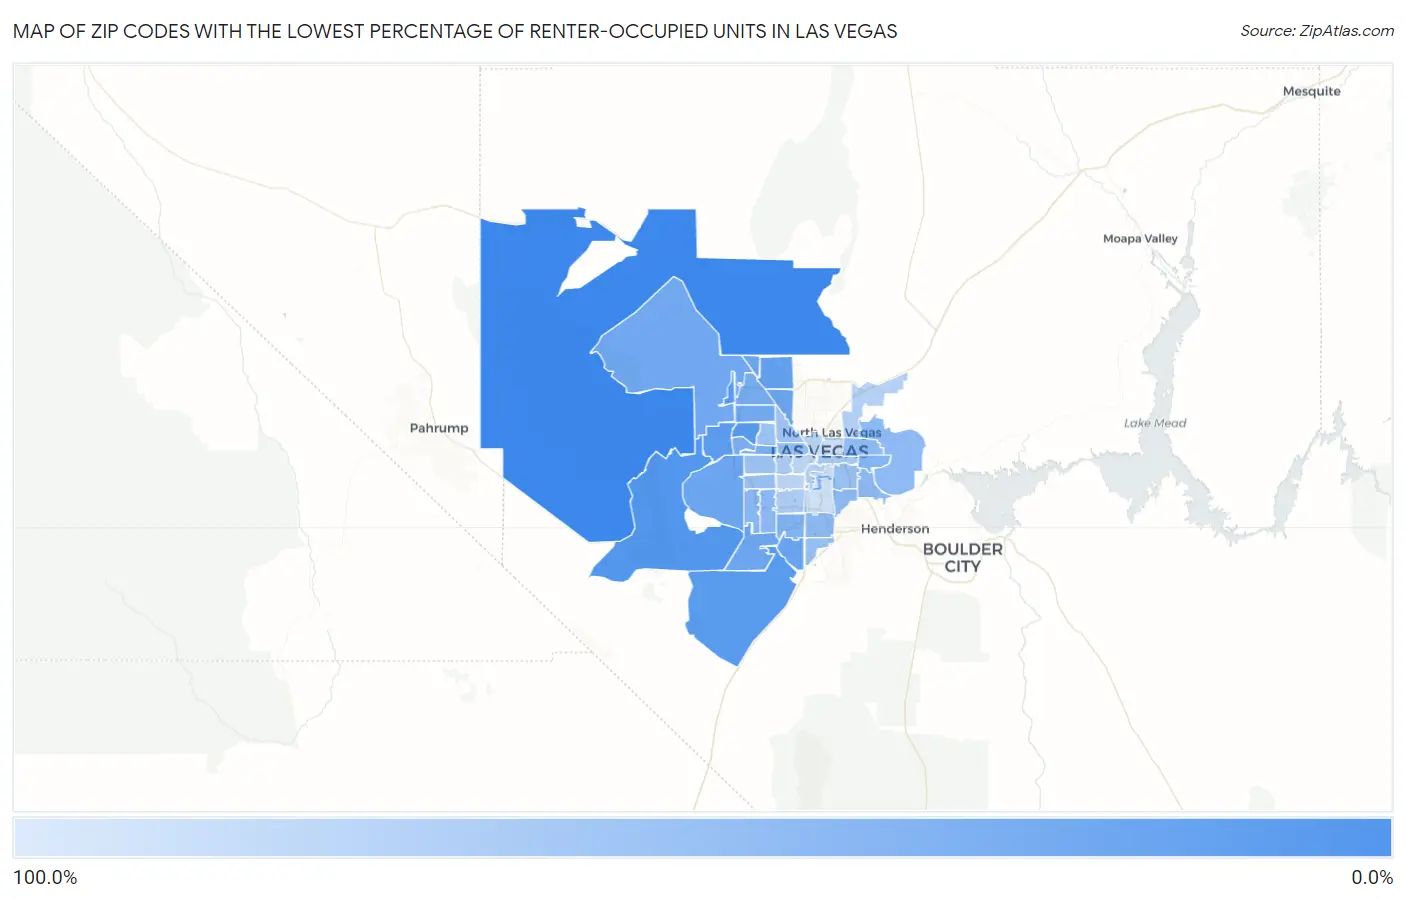
Map of Zip Codes with the Lowest Percentage of Renter-Occupied Units in Las Vegas
81.0%
7.3%
Zip Codes with the Lowest Percentage of Renter-Occupied Units in Las Vegas, NV
| Zip Code | % Renter-Occupied | vs State | vs National | |
| 1. | 89124 | 7.3% | 41.6%(-34.3)#7 | 35.2%(-27.9)#2,087 |
| 2. | 89161 | 16.3% | 41.6%(-25.3)#23 | 35.2%(-18.9)#9,262 |
| 3. | 89134 | 17.9% | 41.6%(-23.7)#30 | 35.2%(-17.3)#10,821 |
| 4. | 89179 | 18.7% | 41.6%(-22.9)#33 | 35.2%(-16.5)#11,625 |
| 5. | 89138 | 19.7% | 41.6%(-21.9)#35 | 35.2%(-15.5)#12,580 |
| 6. | 89131 | 22.7% | 41.6%(-18.9)#40 | 35.2%(-12.5)#15,388 |
| 7. | 89141 | 25.6% | 41.6%(-15.9)#47 | 35.2%(-9.56)#17,985 |
| 8. | 89135 | 26.8% | 41.6%(-14.8)#51 | 35.2%(-8.40)#18,857 |
| 9. | 89143 | 26.9% | 41.6%(-14.7)#52 | 35.2%(-8.29)#18,927 |
| 10. | 89130 | 27.2% | 41.6%(-14.3)#54 | 35.2%(-7.94)#19,169 |
| 11. | 89178 | 28.5% | 41.6%(-13.0)#62 | 35.2%(-6.64)#20,090 |
| 12. | 89166 | 28.9% | 41.6%(-12.6)#64 | 35.2%(-6.25)#20,355 |
| 13. | 89129 | 31.1% | 41.6%(-10.5)#75 | 35.2%(-4.12)#21,707 |
| 14. | 89149 | 32.2% | 41.6%(-9.35)#81 | 35.2%(-2.97)#22,376 |
| 15. | 89145 | 34.4% | 41.6%(-7.20)#90 | 35.2%(-0.820)#23,420 |
| 16. | 89144 | 34.9% | 41.6%(-6.64)#92 | 35.2%(-0.258)#23,712 |
| 17. | 89139 | 37.0% | 41.6%(-4.60)#95 | 35.2%(+1.79)#24,605 |
| 18. | 89142 | 38.7% | 41.6%(-2.83)#102 | 35.2%(+3.56)#25,293 |
| 19. | 89148 | 41.2% | 41.6%(-0.357)#108 | 35.2%(+6.03)#26,059 |
| 20. | 89122 | 42.1% | 41.6%(+0.486)#110 | 35.2%(+6.87)#26,280 |
| 21. | 89113 | 42.6% | 41.6%(+1.02)#112 | 35.2%(+7.40)#26,407 |
| 22. | 89156 | 43.1% | 41.6%(+1.55)#113 | 35.2%(+7.93)#26,550 |
| 23. | 89120 | 43.4% | 41.6%(+1.84)#114 | 35.2%(+8.22)#26,634 |
| 24. | 89123 | 43.8% | 41.6%(+2.28)#116 | 35.2%(+8.66)#26,742 |
| 25. | 89158 | 45.6% | 41.6%(+4.02)#120 | 35.2%(+10.4)#27,175 |
| 26. | 89110 | 46.2% | 41.6%(+4.61)#121 | 35.2%(+11.0)#27,311 |
| 27. | 89183 | 47.4% | 41.6%(+5.87)#125 | 35.2%(+12.3)#27,545 |
| 28. | 89107 | 48.2% | 41.6%(+6.67)#126 | 35.2%(+13.1)#27,705 |
| 29. | 89147 | 49.0% | 41.6%(+7.43)#127 | 35.2%(+13.8)#27,832 |
| 30. | 89121 | 49.5% | 41.6%(+7.90)#129 | 35.2%(+14.3)#27,921 |
| 31. | 89128 | 50.2% | 41.6%(+8.67)#131 | 35.2%(+15.1)#28,059 |
| 32. | 89117 | 52.4% | 41.6%(+10.8)#132 | 35.2%(+17.2)#28,387 |
| 33. | 89108 | 52.6% | 41.6%(+11.0)#133 | 35.2%(+17.4)#28,412 |
| 34. | 89104 | 57.3% | 41.6%(+15.7)#142 | 35.2%(+22.1)#29,030 |
| 35. | 89118 | 58.9% | 41.6%(+17.3)#144 | 35.2%(+23.7)#29,196 |
| 36. | 89146 | 59.1% | 41.6%(+17.5)#145 | 35.2%(+23.9)#29,207 |
| 37. | 89109 | 63.7% | 41.6%(+22.2)#147 | 35.2%(+28.5)#29,615 |
| 38. | 89115 | 64.5% | 41.6%(+22.9)#148 | 35.2%(+29.3)#29,691 |
| 39. | 89106 | 67.6% | 41.6%(+26.1)#152 | 35.2%(+32.5)#29,901 |
| 40. | 89103 | 68.9% | 41.6%(+27.3)#153 | 35.2%(+33.7)#29,979 |
| 41. | 89102 | 71.0% | 41.6%(+29.4)#154 | 35.2%(+35.8)#30,090 |
| 42. | 89169 | 79.9% | 41.6%(+38.3)#157 | 35.2%(+44.7)#30,428 |
| 43. | 89119 | 80.0% | 41.6%(+38.4)#158 | 35.2%(+44.8)#30,431 |
| 44. | 89101 | 81.0% | 41.6%(+39.4)#159 | 35.2%(+45.8)#30,457 |
1
Common Questions
What are the Top 10 Zip Codes with the Lowest Percentage of Renter-Occupied Units in Las Vegas, NV?
Top 10 Zip Codes with the Lowest Percentage of Renter-Occupied Units in Las Vegas, NV are:
What zip code has the Lowest Percentage of Renter-Occupied Units in Las Vegas, NV?
89124 has the Lowest Percentage of Renter-Occupied Units in Las Vegas, NV with 7.3%.
What is the Percentage of Renter-Occupied Units in Las Vegas, NV?
Percentage of Renter-Occupied Units in Las Vegas is 45.2%.
What is the Percentage of Renter-Occupied Units in Nevada?
Percentage of Renter-Occupied Units in Nevada is 41.6%.
What is the Percentage of Renter-Occupied Units in the United States?
Percentage of Renter-Occupied Units in the United States is 35.2%.