Zip Codes with the Highest Percentage of Population Employed in Accommodation & Food Services in Las Vegas, NV

RELATED REPORTS & OPTIONS

Accommodation & Food Services
Population
Families and Households
Female Fertility
Female Fertility (Unmarried)
Race (Community Size)
Race (Percentage)
Ancestry (Community Size)
AfghanAfricanAlaska NativeAlbanianAleutAmericanApacheArabArapahoArgentineanArmenianAssyrian / Chaldean / SyriacAustralianAustrianBangladeshiBarbadianBasqueBelgianBelizeanBhutaneseBlackfeetBolivianBrazilianBritishBritish West IndianBulgarianBurmeseCajunCambodianCanadianCape VerdeanCelticCentral AmericanCentral American IndianCherokeeCheyenneChickasawChileanChineseChippewaChoctawColombianComancheCosta RicanCreeCreekCroatianCubanCzechCzechoslovakianDanishDelawareDominicanDutchDutch West IndianEastern EuropeanEcuadorianEgyptianEnglishEstonianEthiopianEuropeanFijianFilipinoFinnishFrenchFrench American IndianFrench CanadianGermanGerman RussianGhanaianGreekGuamanian / ChamorroGuatemalanGuyaneseHaitianHonduranHopiHungarianIcelanderIndian (Asian)IndonesianInupiatIranianIraqiIrishIroquoisIsraeliItalianJamaicanJapaneseJordanianKenyanKoreanLaotianLatvianLebaneseLiberianLithuanianLuxembourgerMacedonianMalaysianMalteseMenomineeMexicanMexican American IndianMongolianMoroccanNative HawaiianNavajoNew ZealanderNicaraguanNigerianNorthern EuropeanNorwegianOkinawanOsagePaiutePakistaniPalestinianPanamanianParaguayanPennsylvania GermanPeruvianPimaPolishPortuguesePotawatomiPuebloPuerto RicanPuget Sound SalishRomanianRussianSalvadoranSamoanScandinavianScotch-IrishScottishSeminoleSenegaleseSerbianShoshoneSierra LeoneanSiouxSlavicSlovakSloveneSomaliSouth AfricanSouth AmericanSouth American IndianSoviet UnionSpaniardSpanishSpanish AmericanSpanish American IndianSri LankanSubsaharan AfricanSudaneseSwedishSwissSyrianThaiTlingit-HaidaTohono O'OdhamTonganTrinidadian and TobagonianTurkishU.S. Virgin IslanderUgandanUkrainianUruguayanUteVenezuelanVietnameseWelshWest IndianYaquiYugoslavianYumanYup'ikZimbabwean
Ancestry (Percentage)
AfghanAfricanAlaska NativeAlbanianAleutAmericanApacheArabArapahoArgentineanArmenianAssyrian / Chaldean / SyriacAustralianAustrianBangladeshiBarbadianBasqueBelgianBelizeanBhutaneseBlackfeetBolivianBrazilianBritishBritish West IndianBulgarianBurmeseCajunCambodianCanadianCape VerdeanCelticCentral AmericanCentral American IndianCherokeeCheyenneChickasawChileanChineseChippewaChoctawColombianComancheCosta RicanCreeCreekCroatianCubanCzechCzechoslovakianDanishDelawareDominicanDutchDutch West IndianEastern EuropeanEcuadorianEgyptianEnglishEstonianEthiopianEuropeanFijianFilipinoFinnishFrenchFrench American IndianFrench CanadianGermanGerman RussianGhanaianGreekGuamanian / ChamorroGuatemalanGuyaneseHaitianHonduranHopiHungarianIcelanderIndian (Asian)IndonesianInupiatIranianIraqiIrishIroquoisIsraeliItalianJamaicanJapaneseJordanianKenyanKoreanLaotianLatvianLebaneseLiberianLithuanianLuxembourgerMacedonianMalaysianMalteseMenomineeMexicanMexican American IndianMongolianMoroccanNative HawaiianNavajoNew ZealanderNicaraguanNigerianNorthern EuropeanNorwegianOkinawanOsagePaiutePakistaniPalestinianPanamanianParaguayanPennsylvania GermanPeruvianPimaPolishPortuguesePotawatomiPuebloPuerto RicanPuget Sound SalishRomanianRussianSalvadoranSamoanScandinavianScotch-IrishScottishSeminoleSenegaleseSerbianShoshoneSierra LeoneanSiouxSlavicSlovakSloveneSomaliSouth AfricanSouth AmericanSouth American IndianSoviet UnionSpaniardSpanishSpanish AmericanSpanish American IndianSri LankanSubsaharan AfricanSudaneseSwedishSwissSyrianThaiTlingit-HaidaTohono O'OdhamTonganTrinidadian and TobagonianTurkishU.S. Virgin IslanderUgandanUkrainianUruguayanUteVenezuelanVietnameseWelshWest IndianYaquiYugoslavianYumanYup'ikZimbabwean
Immigrant Origin (Total)
AfghanistanAfricaAlbaniaArgentinaArmeniaAsiaAustraliaAustriaBahamasBangladeshBarbadosBelarusBelgiumBelizeBoliviaBosnia and HerzegovinaBrazilBulgariaBurma / MyanmarCambodiaCameroonCanadaCaribbeanCentral AmericaChileChinaColombiaCosta RicaCroatiaCubaCzechoslovakiaDenmarkDominican RepublicEastern AfricaEastern AsiaEastern EuropeEcuadorEgyptEl SalvadorEnglandEritreaEthiopiaEuropeFijiFranceGermanyGhanaGreeceGuatemalaGuyanaHaitiHondurasHong KongHungaryIndiaIndonesiaIranIraqIrelandIsraelItalyJamaicaJapanJordanKazakhstanKenyaKoreaLaosLatin AmericaLatviaLebanonLiberiaLithuaniaMalaysiaMexicoMicronesiaMiddle AfricaMoldovaMoroccoNepalNetherlandsNicaraguaNigeriaNorth MacedoniaNorthern AfricaNorthern EuropeNorwayOceaniaPakistanPanamaPeruPhilippinesPolandPortugalRomaniaRussiaSaudi ArabiaScotlandSenegalSerbiaSierra LeoneSingaporeSomaliaSouth AfricaSouth AmericaSouth Central AsiaSouth Eastern AsiaSouthern EuropeSpainSri LankaSudanSwedenSwitzerlandSyriaTaiwanThailandTrinidad and TobagoTurkeyUgandaUkraineUruguayUzbekistanVenezuelaVietnamWest IndiesWestern AfricaWestern AsiaWestern EuropeYemenZaireZimbabwe
Immigrant Origin (Percentage)
AfghanistanAfricaAlbaniaArgentinaArmeniaAsiaAustraliaAustriaBahamasBangladeshBarbadosBelarusBelgiumBelizeBoliviaBosnia and HerzegovinaBrazilBulgariaBurma / MyanmarCambodiaCameroonCanadaCaribbeanCentral AmericaChileChinaColombiaCosta RicaCroatiaCubaCzechoslovakiaDenmarkDominican RepublicEastern AfricaEastern AsiaEastern EuropeEcuadorEgyptEl SalvadorEnglandEritreaEthiopiaEuropeFijiFranceGermanyGhanaGreeceGuatemalaGuyanaHaitiHondurasHong KongHungaryIndiaIndonesiaIranIraqIrelandIsraelItalyJamaicaJapanJordanKazakhstanKenyaKoreaLaosLatin AmericaLatviaLebanonLiberiaLithuaniaMalaysiaMexicoMicronesiaMiddle AfricaMoldovaMoroccoNepalNetherlandsNicaraguaNigeriaNorth MacedoniaNorthern AfricaNorthern EuropeNorwayOceaniaPakistanPanamaPeruPhilippinesPolandPortugalRomaniaRussiaSaudi ArabiaScotlandSenegalSerbiaSierra LeoneSingaporeSomaliaSouth AfricaSouth AmericaSouth Central AsiaSouth Eastern AsiaSouthern EuropeSpainSri LankaSudanSwedenSwitzerlandSyriaTaiwanThailandTrinidad and TobagoTurkeyUgandaUkraineUruguayUzbekistanVenezuelaVietnamWest IndiesWestern AfricaWestern AsiaWestern EuropeYemenZaireZimbabwe
Income
Income (Families)
Income (Households)
Poverty
Poverty (Families)
Unemployment
Employment Occupations
Employment Industries
Employer Class
Commute Time
Commute Means
School Enrollment
Education by Degree Field
Occupancy
Finances
Physical Characteristics
Las Vegas
Compare Zip Codes
Comparison Subject

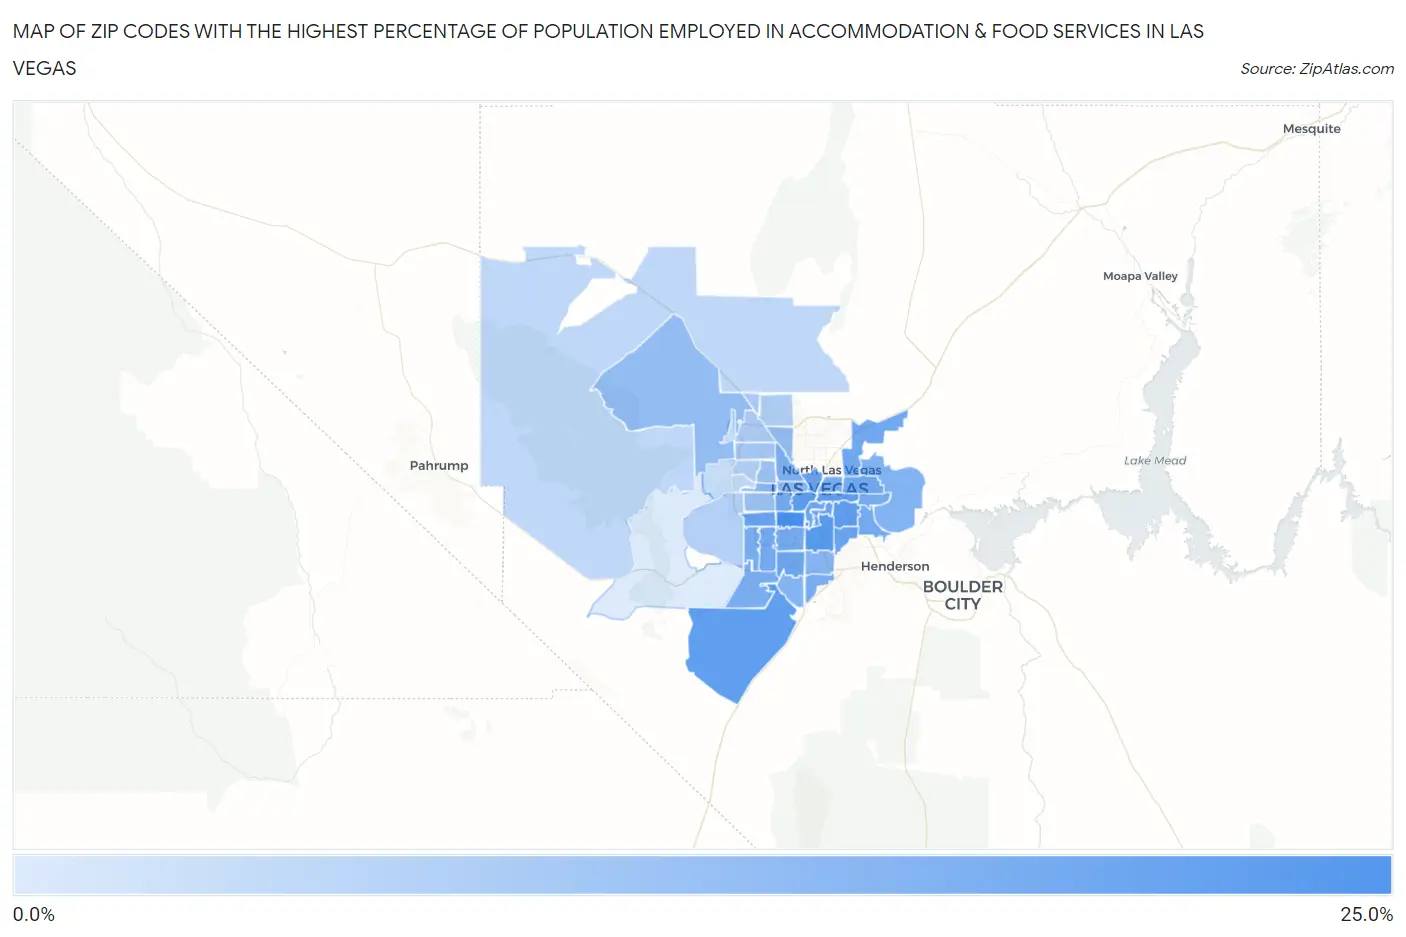
Map of Zip Codes with the Highest Percentage of Population Employed in Accommodation & Food Services in Las Vegas

0.0%
25.0%
Zip Codes with the Highest Percentage of Population Employed in Accommodation & Food Services in Las Vegas Map

Zip Codes with the Highest Percentage of Population Employed in Accommodation & Food Services in Las Vegas, NV

Zip Code % Employed vs State vs National
1.8910324.7%13.3%(+11.4)#46.9%(+17.8)#521
2.8915823.5%13.3%(+10.3)#56.9%(+16.7)#583
3.8911922.2%13.3%(+8.96)#76.9%(+15.3)#660
4.8910221.3%13.3%(+8.01)#86.9%(+14.4)#730
5.8912120.9%13.3%(+7.61)#96.9%(+14.0)#755
6.8917920.8%13.3%(+7.58)#106.9%(+14.0)#757
7.8910420.8%13.3%(+7.52)#116.9%(+13.9)#762
8.8910619.7%13.3%(+6.45)#126.9%(+12.8)#859
9.8914719.7%13.3%(+6.40)#136.9%(+12.8)#862
10.8912019.6%13.3%(+6.32)#146.9%(+12.7)#868
11.8916919.1%13.3%(+5.87)#156.9%(+12.3)#932
12.8913918.9%13.3%(+5.65)#166.9%(+12.0)#957
13.8910918.8%13.3%(+5.55)#176.9%(+11.9)#966
14.8911518.5%13.3%(+5.25)#186.9%(+11.6)#1,012
15.8911018.3%13.3%(+5.03)#196.9%(+11.4)#1,048
16.8914618.1%13.3%(+4.79)#206.9%(+11.2)#1,087
17.8911318.0%13.3%(+4.74)#216.9%(+11.1)#1,094
18.8911817.8%13.3%(+4.51)#226.9%(+10.9)#1,131
19.8912217.7%13.3%(+4.46)#236.9%(+10.8)#1,139
20.8914217.5%13.3%(+4.19)#256.9%(+10.6)#1,189
21.8910117.3%13.3%(+4.06)#276.9%(+10.4)#1,207
22.8917817.3%13.3%(+4.01)#286.9%(+10.4)#1,222
23.8918317.2%13.3%(+3.96)#296.9%(+10.3)#1,229
24.8914817.1%13.3%(+3.86)#306.9%(+10.2)#1,241
25.8910816.6%13.3%(+3.30)#326.9%(+9.68)#1,335
26.8915616.2%13.3%(+2.92)#346.9%(+9.30)#1,410
27.8914115.4%13.3%(+2.13)#356.9%(+8.52)#1,576
28.8912315.3%13.3%(+2.00)#376.9%(+8.38)#1,608
29.8914515.1%13.3%(+1.82)#386.9%(+8.21)#1,648
30.8910714.7%13.3%(+1.40)#416.9%(+7.78)#1,767
31.8916613.7%13.3%(+0.387)#456.9%(+6.77)#2,070
32.8913013.4%13.3%(+0.175)#486.9%(+6.56)#2,162
33.8911712.6%13.3%(-0.629)#526.9%(+5.76)#2,506
34.8912812.5%13.3%(-0.728)#536.9%(+5.66)#2,568
35.8912911.0%13.3%(-2.29)#656.9%(+4.09)#3,575
36.8914910.2%13.3%(-3.12)#716.9%(+3.27)#4,353
37.891439.9%13.3%(-3.32)#746.9%(+3.06)#4,616
38.891319.6%13.3%(-3.67)#796.9%(+2.72)#5,069
39.891349.4%13.3%(-3.91)#816.9%(+2.47)#5,415
40.891359.2%13.3%(-4.11)#846.9%(+2.28)#5,713
41.891247.6%13.3%(-5.70)#916.9%(+0.685)#8,814
42.891447.3%13.3%(-5.92)#966.9%(+0.463)#9,397
43.891386.6%13.3%(-6.66)#1046.9%(-0.270)#11,490
44.891613.7%13.3%(-9.53)#1266.9%(-3.15)#21,007

Common Questions

What are the Top 10 Zip Codes with the Highest Percentage of Population Employed in Accommodation & Food Services in Las Vegas, NV?
Top 10 Zip Codes with the Highest Percentage of Population Employed in Accommodation & Food Services in Las Vegas, NV are:
#1
24.7%
#2
23.5%
#3
22.2%
#4
21.3%
#5
20.9%
#6
20.8%
#7
20.8%
#8
19.7%
#9
19.7%
#10
19.6%
What zip code has the Highest Percentage of Population Employed in Accommodation & Food Services in Las Vegas, NV?
89103 has the Highest Percentage of Population Employed in Accommodation & Food Services in Las Vegas, NV with 24.7%.
What is the Percentage of Population Employed in Accommodation & Food Services in Las Vegas, NV?
Percentage of Population Employed in Accommodation & Food Services in Las Vegas is 14.0%.
What is the Percentage of Population Employed in Accommodation & Food Services in Nevada?
Percentage of Population Employed in Accommodation & Food Services in Nevada is 13.3%.
What is the Percentage of Population Employed in Accommodation & Food Services in the United States?
Percentage of Population Employed in Accommodation & Food Services in the United States is 6.9%.