Zip Codes with the Highest Percentage of Households with Income Above $100,000 in Las Vegas, NV
RELATED REPORTS & OPTIONS
Household Income | $100k+
Las Vegas
Compare Zip Codes
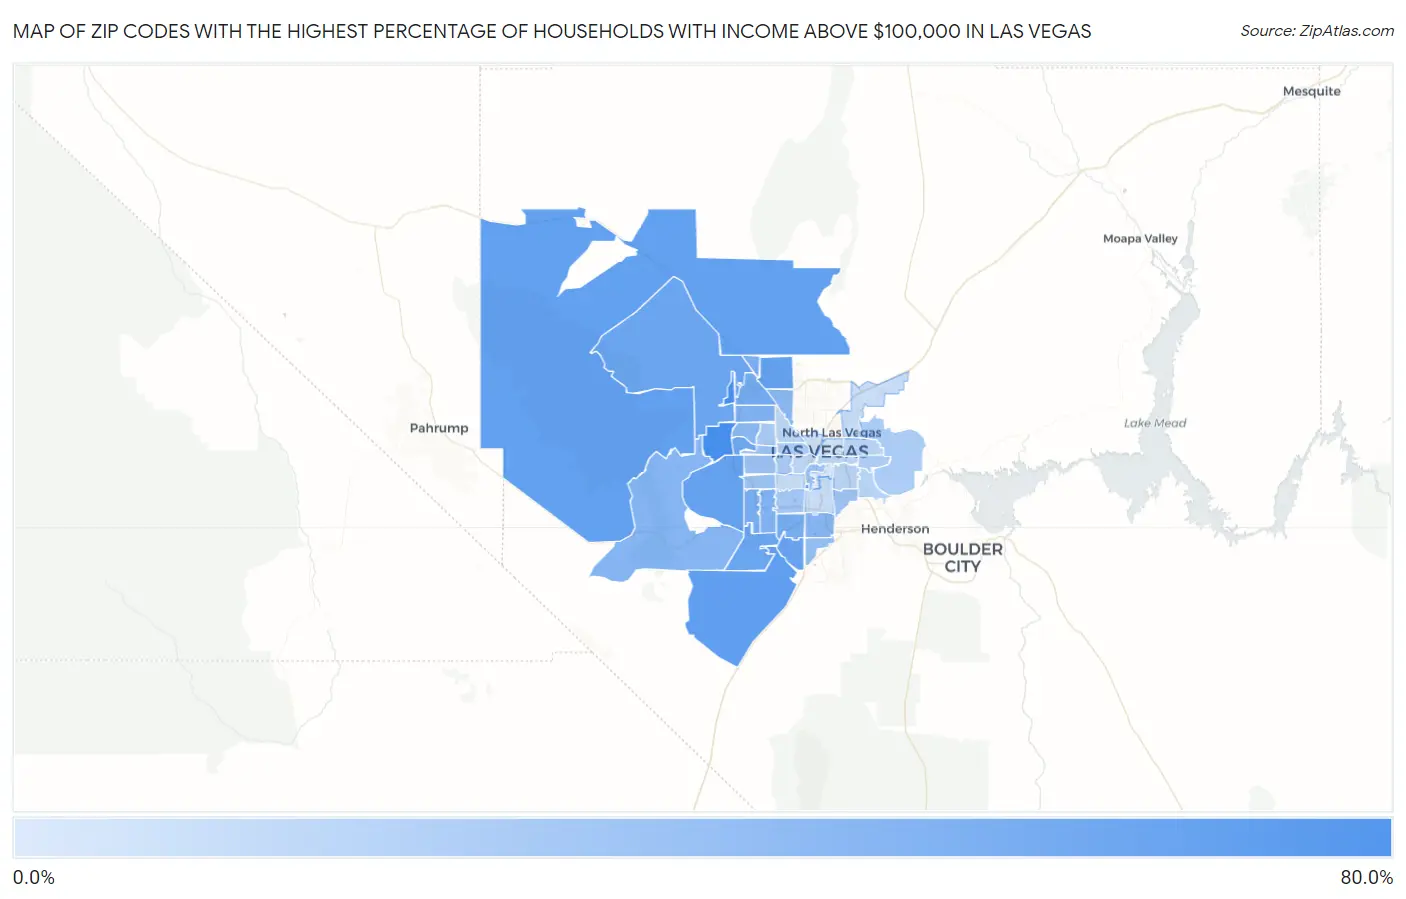
Map of Zip Codes with the Highest Percentage of Households with Income Above $100,000 in Las Vegas
7.9%
69.8%
Zip Codes with the Highest Percentage of Households with Income Above $100,000 in Las Vegas, NV
| Zip Code | Households with Income > $100k | vs State | vs National | |
| 1. | 89138 | 69.8% | 34.4%(+35.4)#6 | 37.3%(+32.5)#985 |
| 2. | 89158 | 59.0% | 34.4%(+24.6)#14 | 37.3%(+21.7)#2,576 |
| 3. | 89179 | 57.6% | 34.4%(+23.2)#17 | 37.3%(+20.3)#2,852 |
| 4. | 89124 | 56.5% | 34.4%(+22.1)#21 | 37.3%(+19.2)#3,101 |
| 5. | 89135 | 55.5% | 34.4%(+21.1)#22 | 37.3%(+18.2)#3,319 |
| 6. | 89131 | 55.1% | 34.4%(+20.7)#24 | 37.3%(+17.8)#3,416 |
| 7. | 89141 | 53.9% | 34.4%(+19.5)#26 | 37.3%(+16.6)#3,738 |
| 8. | 89166 | 51.6% | 34.4%(+17.2)#30 | 37.3%(+14.3)#4,363 |
| 9. | 89178 | 51.4% | 34.4%(+17.0)#31 | 37.3%(+14.1)#4,428 |
| 10. | 89144 | 51.0% | 34.4%(+16.6)#32 | 37.3%(+13.7)#4,540 |
| 11. | 89149 | 47.9% | 34.4%(+13.5)#37 | 37.3%(+10.6)#5,527 |
| 12. | 89139 | 46.5% | 34.4%(+12.1)#39 | 37.3%(+9.20)#6,003 |
| 13. | 89148 | 45.5% | 34.4%(+11.1)#42 | 37.3%(+8.20)#6,386 |
| 14. | 89143 | 43.3% | 34.4%(+8.90)#47 | 37.3%(+6.00)#7,295 |
| 15. | 89113 | 42.6% | 34.4%(+8.20)#49 | 37.3%(+5.30)#7,606 |
| 16. | 89129 | 42.2% | 34.4%(+7.80)#51 | 37.3%(+4.90)#7,799 |
| 17. | 89161 | 41.0% | 34.4%(+6.60)#56 | 37.3%(+3.70)#8,428 |
| 18. | 89123 | 39.4% | 34.4%(+5.00)#62 | 37.3%(+2.10)#9,217 |
| 19. | 89134 | 38.6% | 34.4%(+4.20)#63 | 37.3%(+1.30)#9,629 |
| 20. | 89130 | 38.4% | 34.4%(+4.00)#64 | 37.3%(+1.10)#9,746 |
| 21. | 89183 | 34.1% | 34.4%(-0.300)#80 | 37.3%(-3.20)#12,326 |
| 22. | 89109 | 32.1% | 34.4%(-2.30)#83 | 37.3%(-5.20)#13,789 |
| 23. | 89117 | 31.1% | 34.4%(-3.30)#86 | 37.3%(-6.20)#14,546 |
| 24. | 89147 | 30.6% | 34.4%(-3.80)#89 | 37.3%(-6.70)#14,951 |
| 25. | 89145 | 30.4% | 34.4%(-4.00)#92 | 37.3%(-6.90)#15,107 |
| 26. | 89120 | 30.1% | 34.4%(-4.30)#94 | 37.3%(-7.20)#15,369 |
| 27. | 89118 | 28.4% | 34.4%(-6.00)#98 | 37.3%(-8.90)#16,777 |
| 28. | 89128 | 27.0% | 34.4%(-7.40)#105 | 37.3%(-10.3)#17,981 |
| 29. | 89146 | 26.1% | 34.4%(-8.30)#110 | 37.3%(-11.2)#18,784 |
| 30. | 89156 | 25.3% | 34.4%(-9.10)#112 | 37.3%(-12.0)#19,477 |
| 31. | 89142 | 24.2% | 34.4%(-10.2)#115 | 37.3%(-13.1)#20,475 |
| 32. | 89107 | 22.9% | 34.4%(-11.5)#119 | 37.3%(-14.4)#21,644 |
| 33. | 89121 | 19.8% | 34.4%(-14.6)#125 | 37.3%(-17.5)#24,185 |
| 34. | 89122 | 19.5% | 34.4%(-14.9)#127 | 37.3%(-17.8)#24,427 |
| 35. | 89110 | 19.3% | 34.4%(-15.1)#128 | 37.3%(-18.0)#24,587 |
| 36. | 89108 | 19.2% | 34.4%(-15.2)#129 | 37.3%(-18.1)#24,653 |
| 37. | 89104 | 18.3% | 34.4%(-16.1)#130 | 37.3%(-19.0)#25,329 |
| 38. | 89102 | 17.8% | 34.4%(-16.6)#132 | 37.3%(-19.5)#25,681 |
| 39. | 89103 | 15.2% | 34.4%(-19.2)#140 | 37.3%(-22.1)#27,410 |
| 40. | 89119 | 15.1% | 34.4%(-19.3)#141 | 37.3%(-22.2)#27,466 |
| 41. | 89115 | 15.0% | 34.4%(-19.4)#142 | 37.3%(-22.3)#27,524 |
| 42. | 89106 | 13.2% | 34.4%(-21.2)#146 | 37.3%(-24.1)#28,485 |
| 43. | 89101 | 11.0% | 34.4%(-23.4)#151 | 37.3%(-26.3)#29,445 |
| 44. | 89169 | 7.9% | 34.4%(-26.5)#158 | 37.3%(-29.4)#30,465 |
1
Common Questions
What are the Top 10 Zip Codes with the Highest Percentage of Households with Income Above $100,000 in Las Vegas, NV?
Top 10 Zip Codes with the Highest Percentage of Households with Income Above $100,000 in Las Vegas, NV are:
What zip code has the Highest Percentage of Households with Income Above $100,000 in Las Vegas, NV?
89138 has the Highest Percentage of Households with Income Above $100,000 in Las Vegas, NV with 69.8%.
What is the Percentage of Households with Income Above $100,000 in Las Vegas, NV?
Percentage of Households with Income Above $100,000 in Las Vegas is 31.5%.
What is the Percentage of Households with Income Above $100,000 in Nevada?
Percentage of Households with Income Above $100,000 in Nevada is 34.4%.
What is the Percentage of Households with Income Above $100,000 in the United States?
Percentage of Households with Income Above $100,000 in the United States is 37.3%.