Zip Codes with the Highest Percentage of Births to Unmarried Women over the Age of 35 in Las Vegas, NV

RELATED REPORTS & OPTIONS

Highest Illegitimacy | Women 35+
Population
Families and Households
Female Fertility
Female Fertility (Unmarried)
Race (Community Size)
Race (Percentage)
Ancestry (Community Size)
AfghanAfricanAlaska NativeAlbanianAleutAmericanApacheArabArapahoArgentineanArmenianAssyrian / Chaldean / SyriacAustralianAustrianBangladeshiBarbadianBasqueBelgianBelizeanBhutaneseBlackfeetBolivianBrazilianBritishBritish West IndianBulgarianBurmeseCajunCambodianCanadianCape VerdeanCelticCentral AmericanCentral American IndianCherokeeCheyenneChickasawChileanChineseChippewaChoctawColombianComancheCosta RicanCreeCreekCroatianCubanCzechCzechoslovakianDanishDelawareDominicanDutchDutch West IndianEastern EuropeanEcuadorianEgyptianEnglishEstonianEthiopianEuropeanFijianFilipinoFinnishFrenchFrench American IndianFrench CanadianGermanGerman RussianGhanaianGreekGuamanian / ChamorroGuatemalanGuyaneseHaitianHonduranHopiHungarianIcelanderIndian (Asian)IndonesianInupiatIranianIraqiIrishIroquoisIsraeliItalianJamaicanJapaneseJordanianKenyanKoreanLaotianLatvianLebaneseLiberianLithuanianLuxembourgerMacedonianMalaysianMalteseMenomineeMexicanMexican American IndianMongolianMoroccanNative HawaiianNavajoNew ZealanderNicaraguanNigerianNorthern EuropeanNorwegianOkinawanOsagePaiutePakistaniPalestinianPanamanianParaguayanPennsylvania GermanPeruvianPimaPolishPortuguesePotawatomiPuebloPuerto RicanPuget Sound SalishRomanianRussianSalvadoranSamoanScandinavianScotch-IrishScottishSeminoleSenegaleseSerbianShoshoneSierra LeoneanSiouxSlavicSlovakSloveneSomaliSouth AfricanSouth AmericanSouth American IndianSoviet UnionSpaniardSpanishSpanish AmericanSpanish American IndianSri LankanSubsaharan AfricanSudaneseSwedishSwissSyrianThaiTlingit-HaidaTohono O'OdhamTonganTrinidadian and TobagonianTurkishU.S. Virgin IslanderUgandanUkrainianUruguayanUteVenezuelanVietnameseWelshWest IndianYaquiYugoslavianYumanYup'ikZimbabwean
Ancestry (Percentage)
AfghanAfricanAlaska NativeAlbanianAleutAmericanApacheArabArapahoArgentineanArmenianAssyrian / Chaldean / SyriacAustralianAustrianBangladeshiBarbadianBasqueBelgianBelizeanBhutaneseBlackfeetBolivianBrazilianBritishBritish West IndianBulgarianBurmeseCajunCambodianCanadianCape VerdeanCelticCentral AmericanCentral American IndianCherokeeCheyenneChickasawChileanChineseChippewaChoctawColombianComancheCosta RicanCreeCreekCroatianCubanCzechCzechoslovakianDanishDelawareDominicanDutchDutch West IndianEastern EuropeanEcuadorianEgyptianEnglishEstonianEthiopianEuropeanFijianFilipinoFinnishFrenchFrench American IndianFrench CanadianGermanGerman RussianGhanaianGreekGuamanian / ChamorroGuatemalanGuyaneseHaitianHonduranHopiHungarianIcelanderIndian (Asian)IndonesianInupiatIranianIraqiIrishIroquoisIsraeliItalianJamaicanJapaneseJordanianKenyanKoreanLaotianLatvianLebaneseLiberianLithuanianLuxembourgerMacedonianMalaysianMalteseMenomineeMexicanMexican American IndianMongolianMoroccanNative HawaiianNavajoNew ZealanderNicaraguanNigerianNorthern EuropeanNorwegianOkinawanOsagePaiutePakistaniPalestinianPanamanianParaguayanPennsylvania GermanPeruvianPimaPolishPortuguesePotawatomiPuebloPuerto RicanPuget Sound SalishRomanianRussianSalvadoranSamoanScandinavianScotch-IrishScottishSeminoleSenegaleseSerbianShoshoneSierra LeoneanSiouxSlavicSlovakSloveneSomaliSouth AfricanSouth AmericanSouth American IndianSoviet UnionSpaniardSpanishSpanish AmericanSpanish American IndianSri LankanSubsaharan AfricanSudaneseSwedishSwissSyrianThaiTlingit-HaidaTohono O'OdhamTonganTrinidadian and TobagonianTurkishU.S. Virgin IslanderUgandanUkrainianUruguayanUteVenezuelanVietnameseWelshWest IndianYaquiYugoslavianYumanYup'ikZimbabwean
Immigrant Origin (Total)
AfghanistanAfricaAlbaniaArgentinaArmeniaAsiaAustraliaAustriaBahamasBangladeshBarbadosBelarusBelgiumBelizeBoliviaBosnia and HerzegovinaBrazilBulgariaBurma / MyanmarCambodiaCameroonCanadaCaribbeanCentral AmericaChileChinaColombiaCosta RicaCroatiaCubaCzechoslovakiaDenmarkDominican RepublicEastern AfricaEastern AsiaEastern EuropeEcuadorEgyptEl SalvadorEnglandEritreaEthiopiaEuropeFijiFranceGermanyGhanaGreeceGuatemalaGuyanaHaitiHondurasHong KongHungaryIndiaIndonesiaIranIraqIrelandIsraelItalyJamaicaJapanJordanKazakhstanKenyaKoreaLaosLatin AmericaLatviaLebanonLiberiaLithuaniaMalaysiaMexicoMicronesiaMiddle AfricaMoldovaMoroccoNepalNetherlandsNicaraguaNigeriaNorth MacedoniaNorthern AfricaNorthern EuropeNorwayOceaniaPakistanPanamaPeruPhilippinesPolandPortugalRomaniaRussiaSaudi ArabiaScotlandSenegalSerbiaSierra LeoneSingaporeSomaliaSouth AfricaSouth AmericaSouth Central AsiaSouth Eastern AsiaSouthern EuropeSpainSri LankaSudanSwedenSwitzerlandSyriaTaiwanThailandTrinidad and TobagoTurkeyUgandaUkraineUruguayUzbekistanVenezuelaVietnamWest IndiesWestern AfricaWestern AsiaWestern EuropeYemenZaireZimbabwe
Immigrant Origin (Percentage)
AfghanistanAfricaAlbaniaArgentinaArmeniaAsiaAustraliaAustriaBahamasBangladeshBarbadosBelarusBelgiumBelizeBoliviaBosnia and HerzegovinaBrazilBulgariaBurma / MyanmarCambodiaCameroonCanadaCaribbeanCentral AmericaChileChinaColombiaCosta RicaCroatiaCubaCzechoslovakiaDenmarkDominican RepublicEastern AfricaEastern AsiaEastern EuropeEcuadorEgyptEl SalvadorEnglandEritreaEthiopiaEuropeFijiFranceGermanyGhanaGreeceGuatemalaGuyanaHaitiHondurasHong KongHungaryIndiaIndonesiaIranIraqIrelandIsraelItalyJamaicaJapanJordanKazakhstanKenyaKoreaLaosLatin AmericaLatviaLebanonLiberiaLithuaniaMalaysiaMexicoMicronesiaMiddle AfricaMoldovaMoroccoNepalNetherlandsNicaraguaNigeriaNorth MacedoniaNorthern AfricaNorthern EuropeNorwayOceaniaPakistanPanamaPeruPhilippinesPolandPortugalRomaniaRussiaSaudi ArabiaScotlandSenegalSerbiaSierra LeoneSingaporeSomaliaSouth AfricaSouth AmericaSouth Central AsiaSouth Eastern AsiaSouthern EuropeSpainSri LankaSudanSwedenSwitzerlandSyriaTaiwanThailandTrinidad and TobagoTurkeyUgandaUkraineUruguayUzbekistanVenezuelaVietnamWest IndiesWestern AfricaWestern AsiaWestern EuropeYemenZaireZimbabwe
Income
Income (Families)
Income (Households)
Poverty
Poverty (Families)
Unemployment
Employment Occupations
Employment Industries
Employer Class
Commute Time
Commute Means
School Enrollment
Education by Degree Field
Occupancy
Finances
Physical Characteristics
Las Vegas
Compare Zip Codes
Comparison Subject

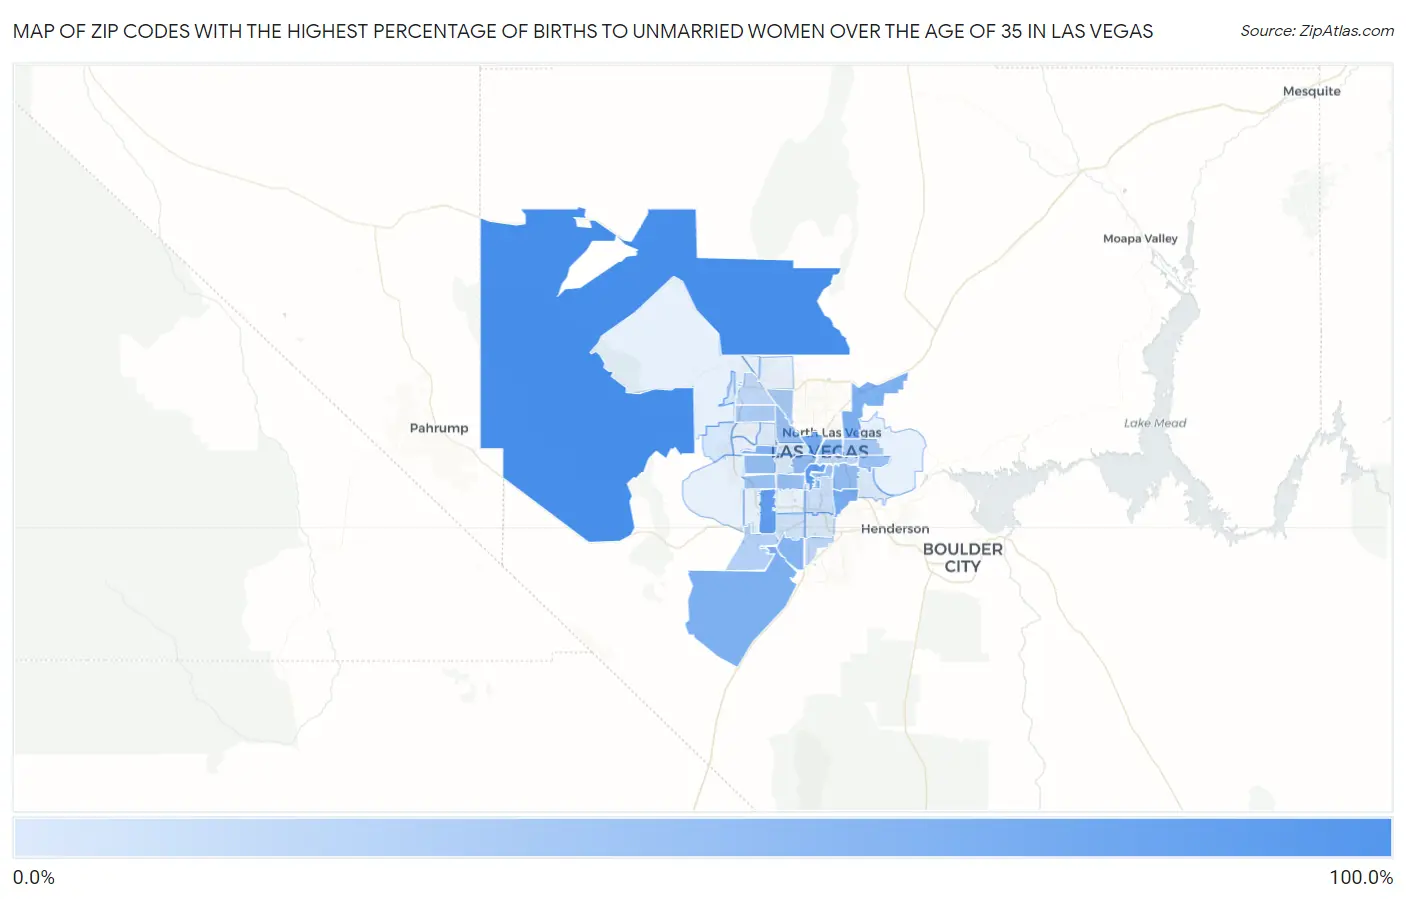
Map of Zip Codes with the Highest Percentage of Births to Unmarried Women over the Age of 35 in Las Vegas

0.0%
100.0%
Zip Codes with the Highest Percentage of Births to Unmarried Women over the Age of 35 in Las Vegas Map

Zip Codes with the Highest Percentage of Births to Unmarried Women over the Age of 35 in Las Vegas, NV

Zip Code % Unmarried vs State vs National
1.89124100.0%29.3%(+70.7)#820.1%(+79.9)#1,301
2.8910986.0%29.3%(+56.7)#1020.1%(+65.9)#1,614
3.8911379.5%29.3%(+50.2)#1220.1%(+59.4)#1,751
4.8910664.6%29.3%(+35.3)#1320.1%(+44.5)#2,189
5.8912063.8%29.3%(+34.5)#1420.1%(+43.7)#2,228
6.8917961.1%29.3%(+31.8)#1620.1%(+41.0)#2,342
7.8911559.6%29.3%(+30.3)#1720.1%(+39.5)#2,406
8.8914555.2%29.3%(+25.9)#1820.1%(+35.1)#2,598
9.8914154.1%29.3%(+24.8)#2020.1%(+34.0)#2,647
10.8910152.1%29.3%(+22.8)#2120.1%(+32.0)#2,749
11.8910248.4%29.3%(+19.1)#2220.1%(+28.3)#2,987
12.8911746.2%29.3%(+16.9)#2520.1%(+26.1)#3,122
13.8912145.9%29.3%(+16.6)#2620.1%(+25.8)#3,136
14.8910344.3%29.3%(+15.0)#2820.1%(+24.2)#3,243
15.8910842.6%29.3%(+13.3)#3220.1%(+22.5)#3,364
16.8914242.3%29.3%(+13.0)#3320.1%(+22.2)#3,377
17.8914741.9%29.3%(+12.6)#3420.1%(+21.8)#3,400
18.8916940.6%29.3%(+11.3)#3520.1%(+20.5)#3,481
19.8911035.6%29.3%(+6.30)#3720.1%(+15.5)#3,865
20.8913034.7%29.3%(+5.40)#3920.1%(+14.6)#3,925
21.8912931.9%29.3%(+2.60)#4120.1%(+11.8)#4,167
22.8917828.3%29.3%(-1.000)#4420.1%(+8.20)#4,469
23.8918322.4%29.3%(-6.90)#4820.1%(+2.30)#5,013
24.8910422.2%29.3%(-7.10)#4920.1%(+2.10)#5,034
25.8914921.2%29.3%(-8.10)#5020.1%(+1.10)#5,159
26.8911917.1%29.3%(-12.2)#5320.1%(-3.00)#5,603
27.8913914.4%29.3%(-14.9)#5420.1%(-5.70)#5,911
28.8910711.6%29.3%(-17.7)#5720.1%(-8.50)#6,256
29.8913811.1%29.3%(-18.2)#5820.1%(-9.00)#6,315
30.891469.6%29.3%(-19.7)#5920.1%(-10.5)#6,466
31.891228.5%29.3%(-20.8)#6120.1%(-11.6)#6,587
32.891238.2%29.3%(-21.1)#6220.1%(-11.9)#6,617
33.891287.6%29.3%(-21.7)#6320.1%(-12.5)#6,695

Common Questions

What are the Top 10 Zip Codes with the Highest Percentage of Births to Unmarried Women over the Age of 35 in Las Vegas, NV?
Top 10 Zip Codes with the Highest Percentage of Births to Unmarried Women over the Age of 35 in Las Vegas, NV are:
#1
100.0%
#2
86.0%
#3
79.5%
#4
64.6%
#5
63.8%
#6
61.1%
#7
59.6%
#8
55.2%
#9
54.1%
#10
52.1%
What zip code has the Highest Percentage of Births to Unmarried Women over the Age of 35 in Las Vegas, NV?
89124 has the Highest Percentage of Births to Unmarried Women over the Age of 35 in Las Vegas, NV with 100.0%.
What is the Percentage of Births to Unmarried Women over the Age of 35 in Las Vegas, NV?
Percentage of Births to Unmarried Women over the Age of 35 in Las Vegas is 34.1%.
What is the Percentage of Births to Unmarried Women over the Age of 35 in Nevada?
Percentage of Births to Unmarried Women over the Age of 35 in Nevada is 29.3%.
What is the Percentage of Births to Unmarried Women over the Age of 35 in the United States?
Percentage of Births to Unmarried Women over the Age of 35 in the United States is 20.1%.